
Comex: Delivery and Inventory Activity Crashes While GLD Having Best Month Ever
The CME Comex is the Exchange where futures are traded for gold, silver, and other commodities. The CME also allows futures buyers to turn their contracts into physical metal through delivery. You can find more detail on the CME here (e.g., vault types, major/minor months, delivery explanation, historical data, etc.).
The data below looks at contract delivery where the ownership of physical metal changes hands within CME vaults. It also shows data that details the movement of metal in and out of CME vaults. It is very possible that if there is a run on the dollar, and a flight into gold, this is the data that will show early warning signs.
Gold
We have been tracking this data for years now. Prior to other price runs, the physical market would flash warning signs. Either delivery volume would start to increase, inventory levels would start to decrease, or both. For the delivery month of July, the data has gone extremely quiet.
Delivery volume has crashed to the lowest level since October 2024, coming in under 20k for the month.
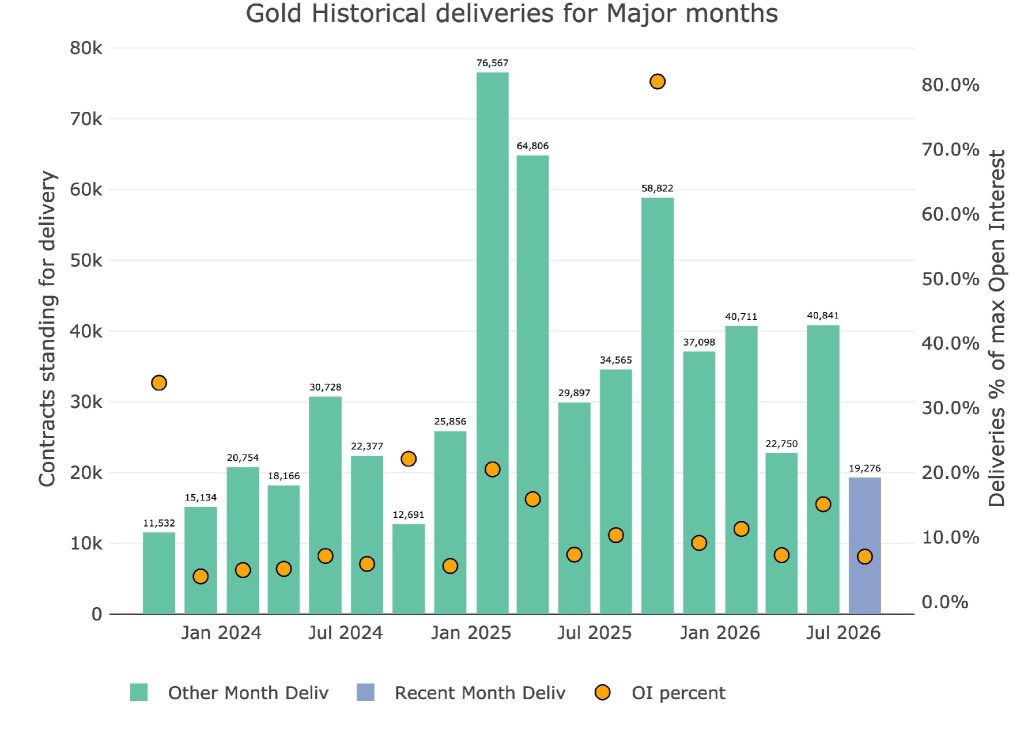
Figure: 1 Recent like-month delivery volume
When looked at from a dollar amount perspective (rather than raw ounces), you can see that the amount delivered is well below the amount last year and even in 2020 when prices were half the current levels. Notional delivery is greater than 2021-2024 but that is mostly a factor of price increases.
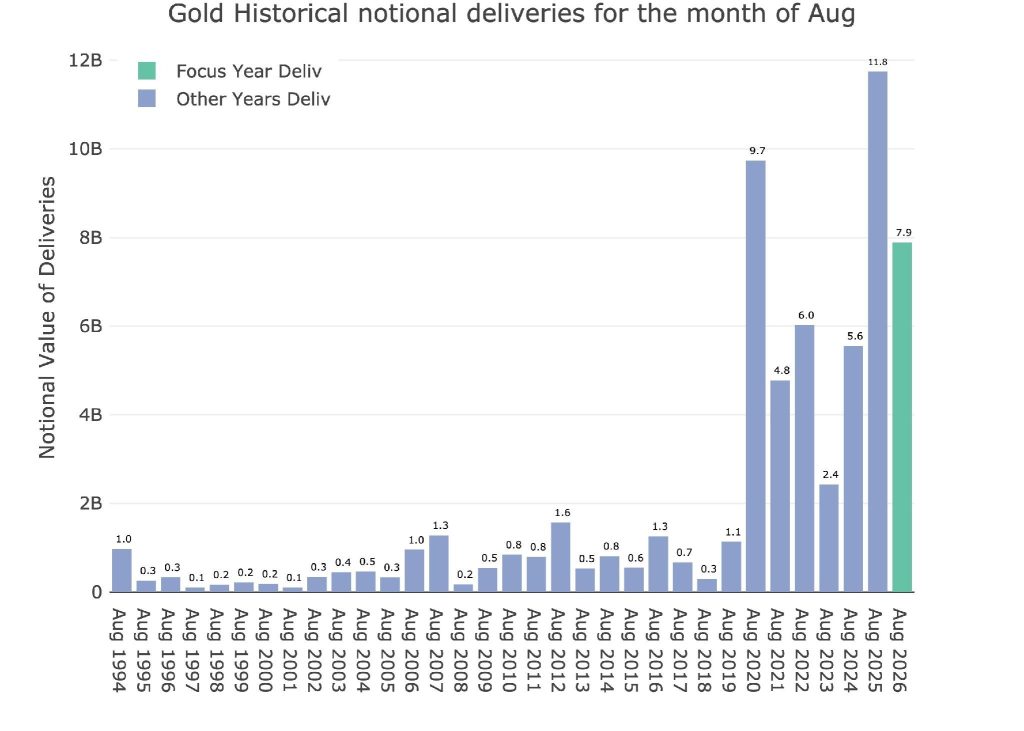
Figure: 2 Notional Deliveries
Net new contracts (contracts that open and settle for immediate delivery) have barely moved for the month of August.
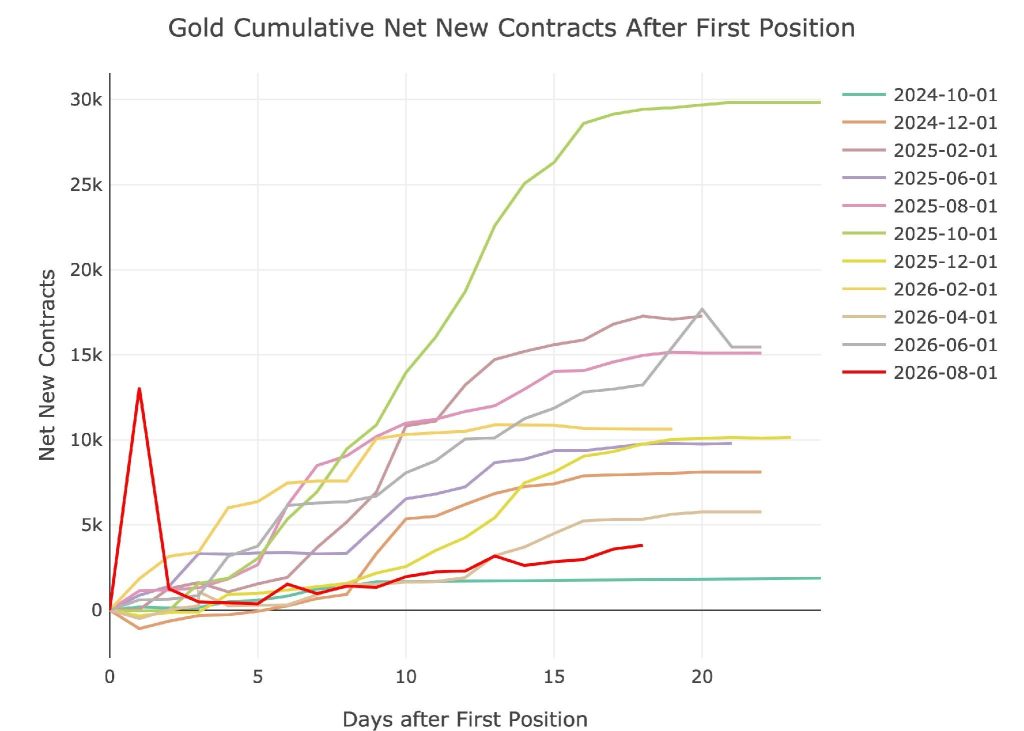
Figure: 3 Cumulative Net New Contracts
The amount of metal actually leaving Comex vaults has also leveled out quite a bit since the massive drawdown seen over the last 12 months.
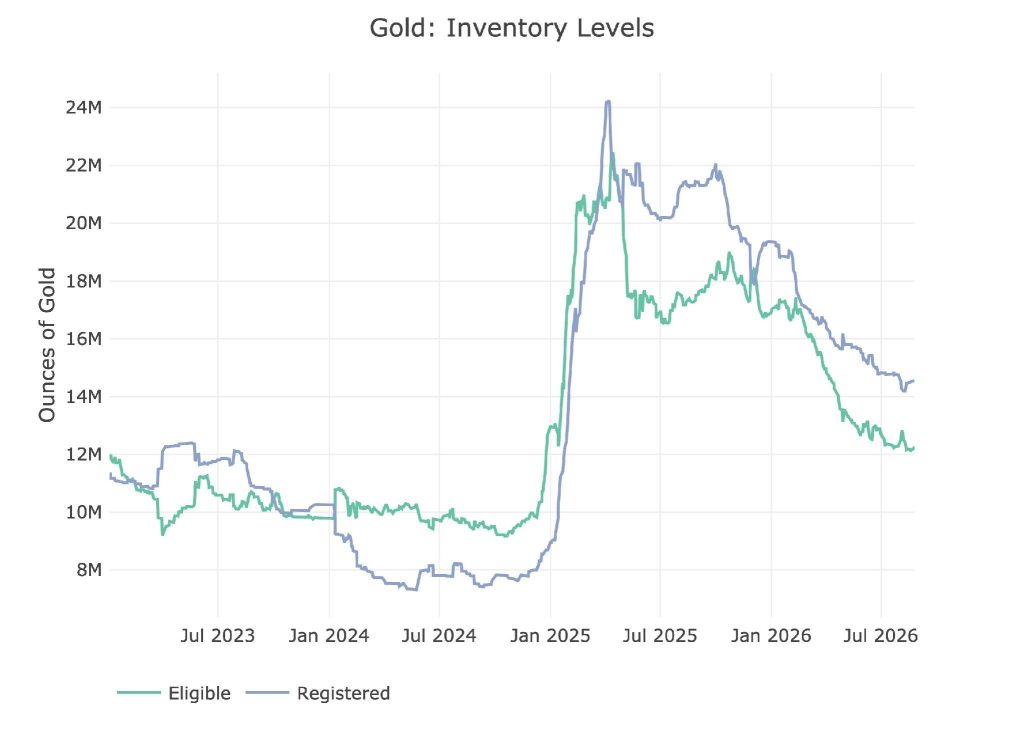
Figure: 4 Inventory Data
Looking ahead to the September delivery period (a minor month for gold), we see a contract that is well below average, near the bottom of the range as the roll date approaches.
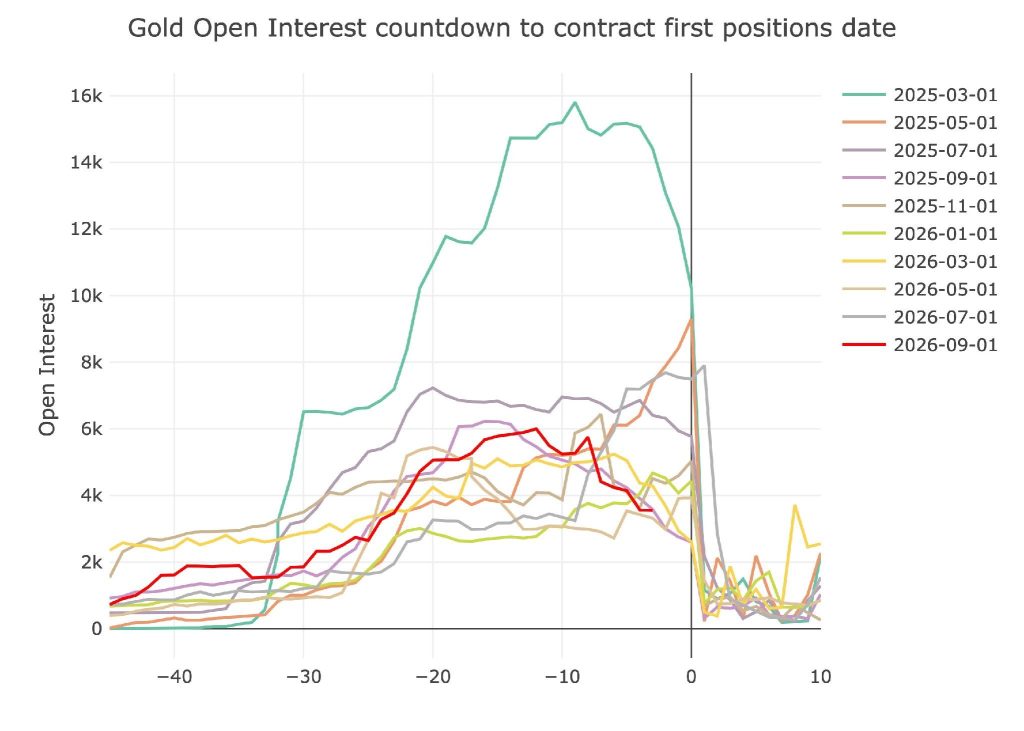
Figure: 5 Open Interest Countdown
Even on a relative basis, the demand is looking rather weak.
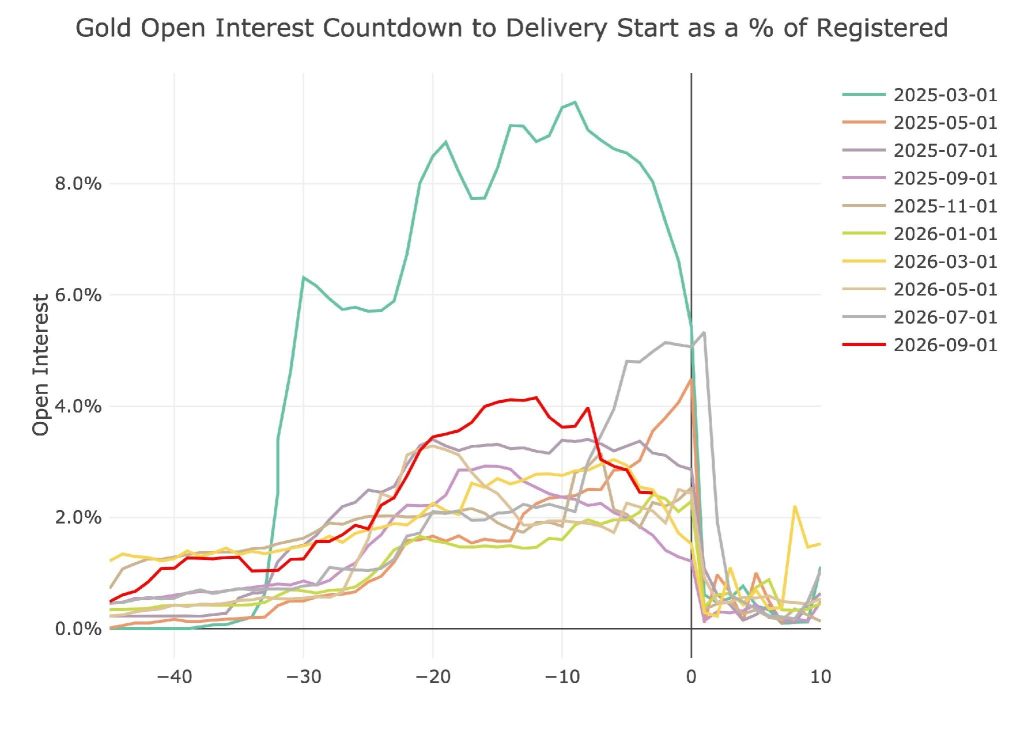
Figure: 6 Open Interest Countdown Percent
Bottom line, delivery volumes have fallen and the exodus of gold from Comex vault has paused.
Silver
Silver price spreads have returned to normal.
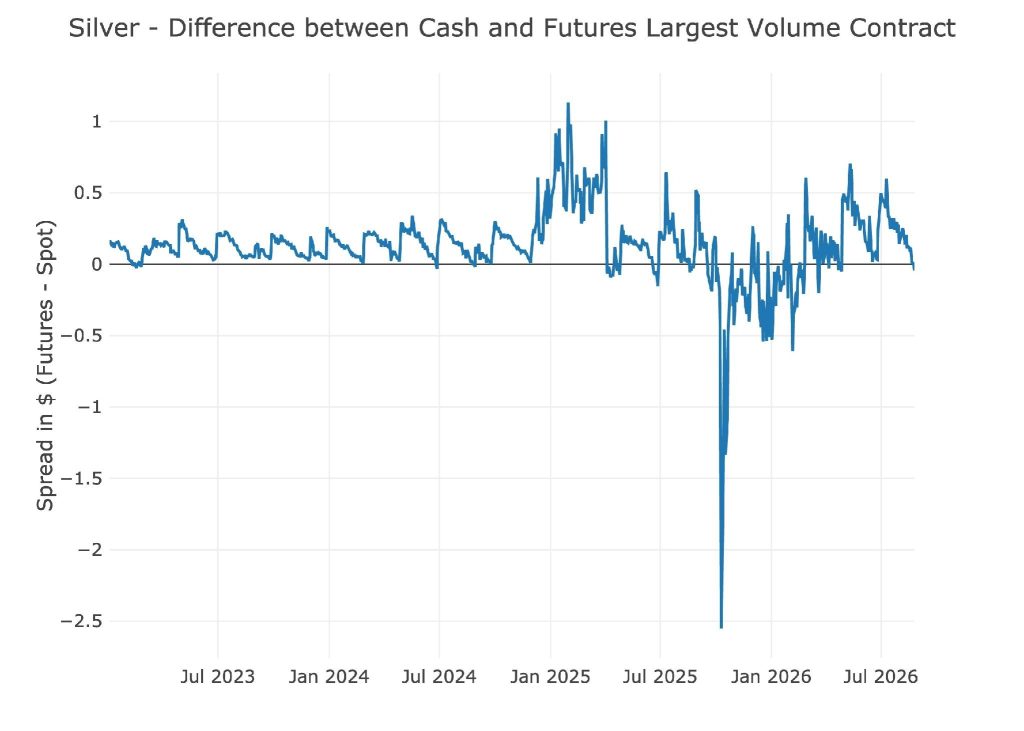
Figure: 7 Spot vs Futures
Silver delivery volumes have also collapsed to levels not seen since 2024.
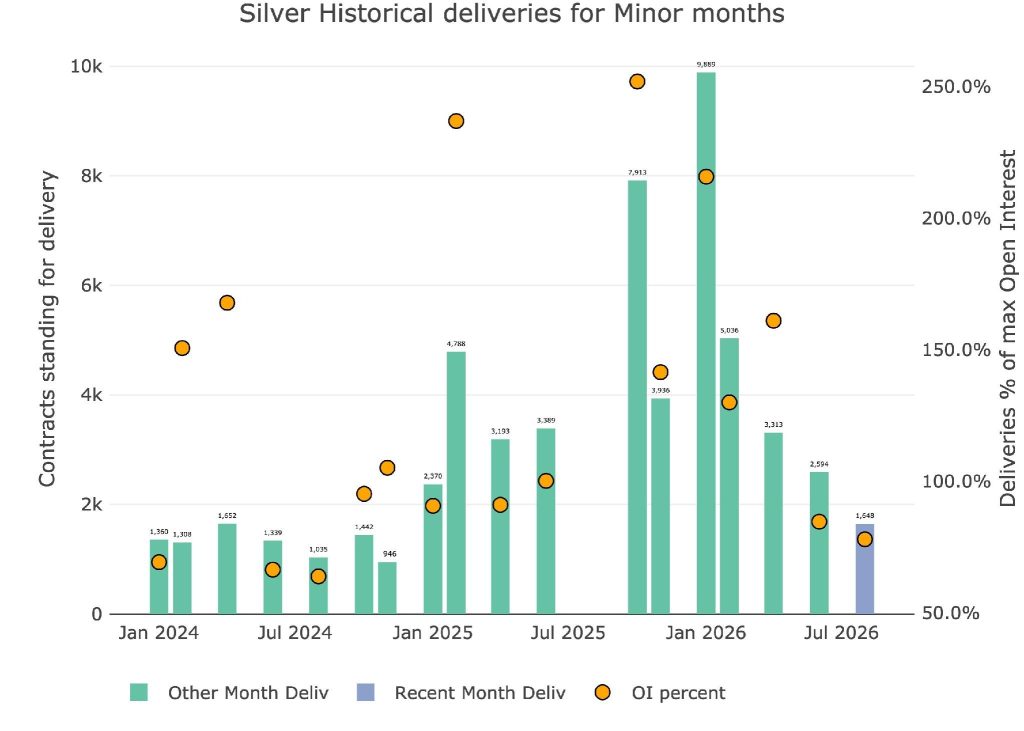
Figure: 8 Recent like-month delivery volume
Notional delivery volume is still very high in silver but this is almost entirely due to the price increase in silver.
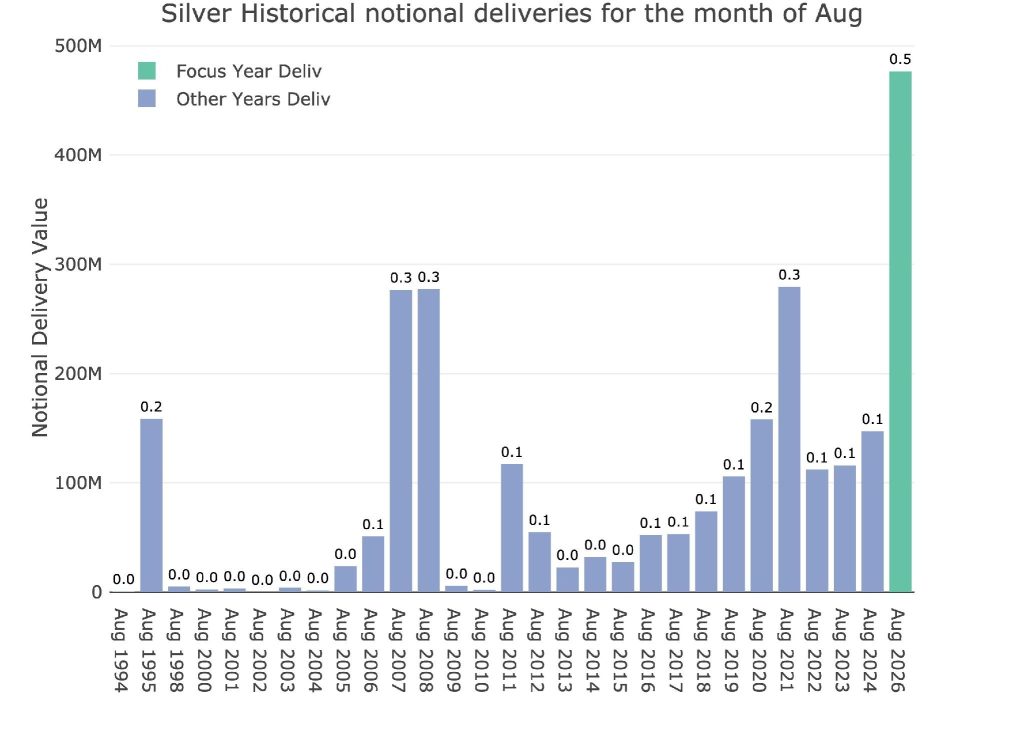
Figure: 9 Notional Deliveries
Silver net new contracts were non-existent.
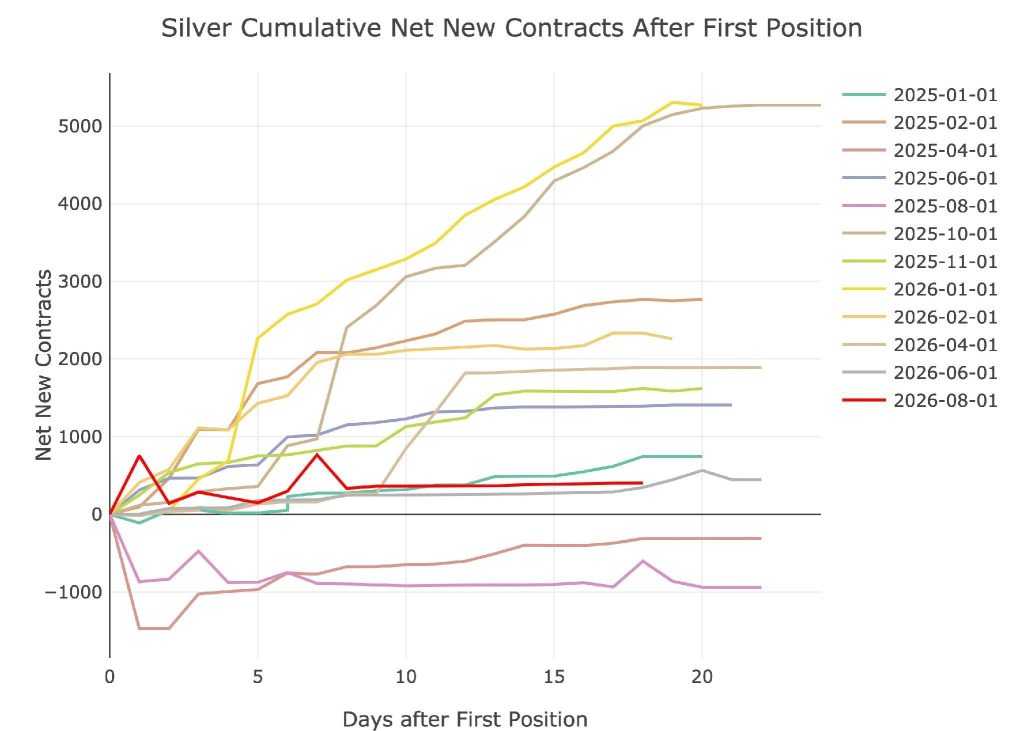
Figure: 10 Cumulative Net New Contracts
Silver has actually been coming into the Comex vaults after a massive depletion this year
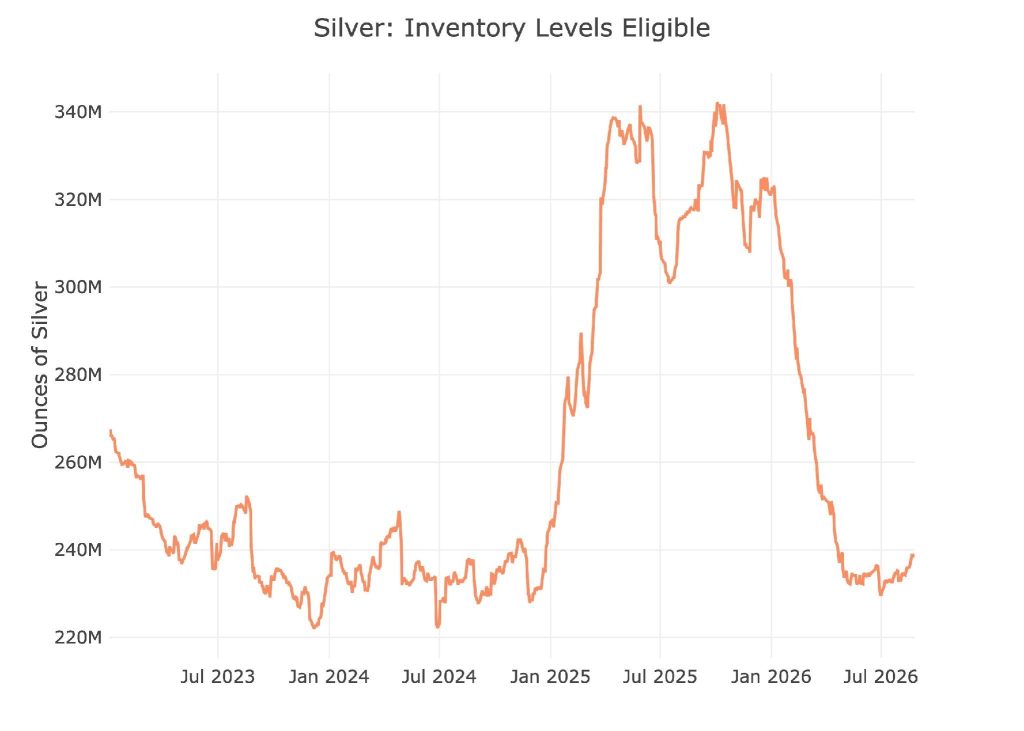
Figure: 11 Inventory Data
Registered metal shows the same thing as Eligible, an increase over the last several weeks.
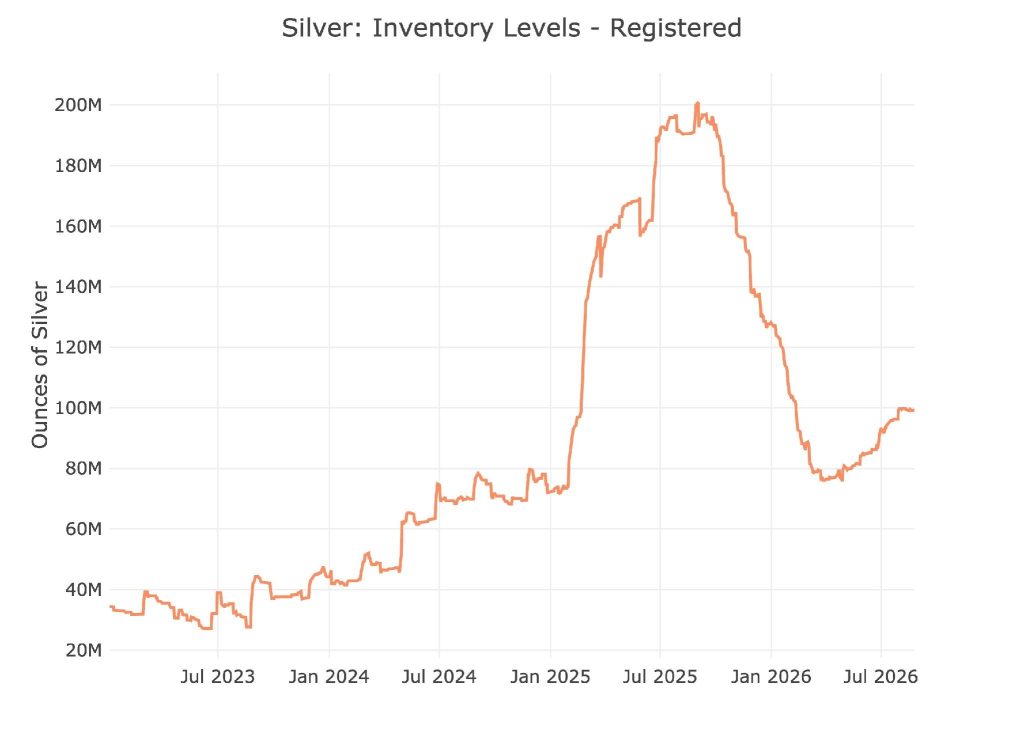
Figure: 12 Inventory Data
As we approach September delivery (major silver month), the silver contract is coming in very weak.
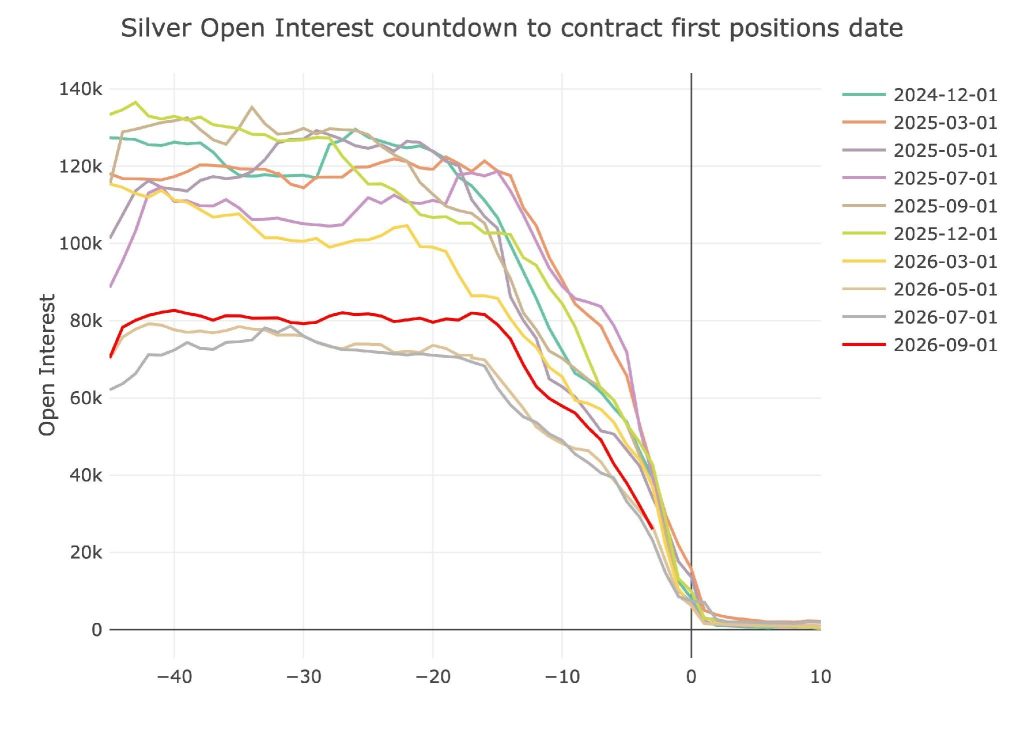
Figure: 13 Open Interest Countdown
Even on a relative basis, it’s middle of the pack at best.
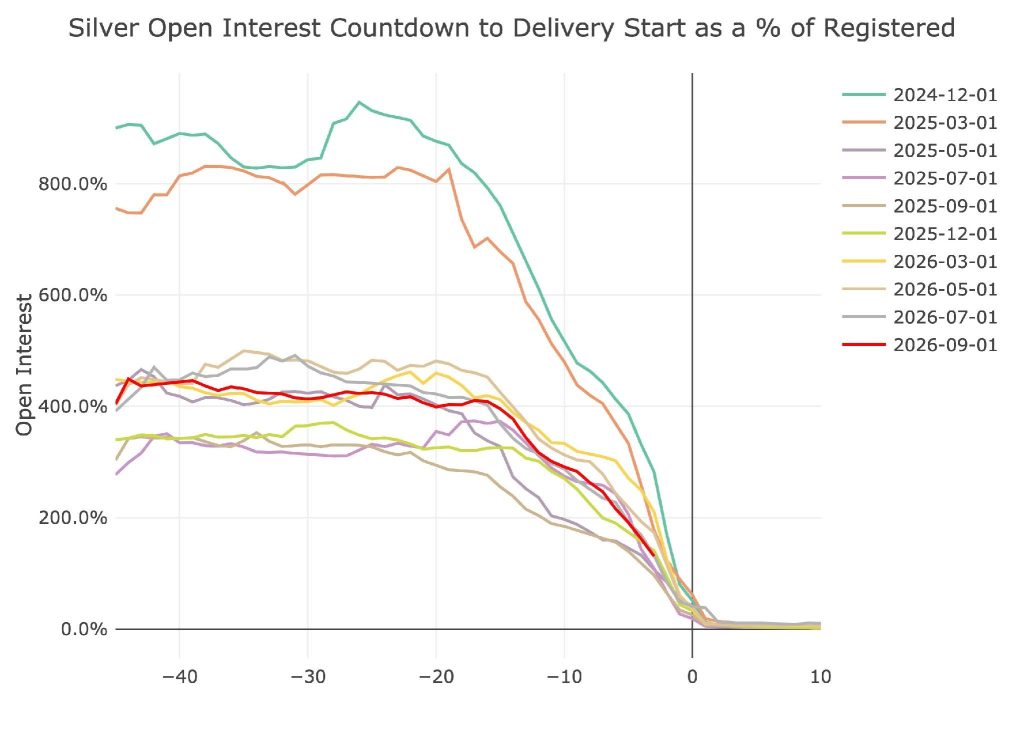
Figure: 14 Open Interest Countdown Percent
Conclusion
The Comex data is where the run on physical metals has been occurring over the last few years. Pressure has built up for physical demand and metal has been leaving Comex vaults, stockpiles get restored and then gets rapidly depleted. Delivery volume has been a fairly good predictor of future price moves.
August is painting a very different picture. While the physical market has gone extremely quiet, the price of gold is having one of its best months in decades. If the price is going to hold and continue moving up, we should expect to see it spill over into the physical market with increased deliveries and depleted inventories.
The current activity does not match the price action here. Lower physical demand does not usually lead to higher prices. GLD is up 15.2% this month which, if it holds, would be a record for the ETF. The next best months came in at:
- Nov 2009 (12.8%) – followed by (Dec 2009): -7.3%
- Nov 2008 (12.6%) – followed by (Dec 2008): +7.7%
- Aug 2011 (12.3%) – followed by (Sep 2011): -11.1%
- Jan 2026 (12.3%) – followed by (Feb 2026): +8.7%
The macro fundamental picture is very bullish for gold, especially with all the recent announcements from the treasury. But the fundamental picture for gold has been bullish for 2 decades, so that cannot be an indicator on its own. The correction was overdone but also needed after such a massive price run up. If we are going to sustain this new move though, we should see physical demand returning soon or the correction may still require more time.

 Live Chat
 Email:
  Phone: 1-888-465-3160