
The Technicals: A Needed Consolidation has Gotten a Bit Uglier
Technical Analysis of Gold and Silver
This analysis attempts to look at different metrics to understand the current momentum in the gold and silver markets. It is meant as an analysis on potential price direction in the very short-term (a few weeks to 1-2 months).
In Q4, the technical analysis was strongly calling for a pullback or at least a consolidation period. The price indicators were quite bearish. The call may have been early by a few weeks but was an essential step if the bull market in both metals was going to continue.
The market received that pullback, consolidating around $5,000 and $80 and has since broken down below both consolidation zones. Looking at the data below, the data is very mixed. The latest pullback will delay the next phase in the bull market, but even the next short-term move is cloudy.
Let’s dive in…
Price Action
Huge spike ups are usually followed by similar spikes down. They are simply not sustainable. Silver got way ahead of itself. Gold had a more steady move up. This is why it was able to hold $5,000 for longer. But that number finally fell after weeks of carving out a base. It fell and fell hard. This likely cleared out a decent amount of hot money, but it also did a ton of technical damage with the speed at which it fell. This makes it unlikely to make an immediate turnaround back to $5,000.
It now becomes critical that $4,500 holds. Gold will have to bide its time and try to sustain a new base. In Silver, $80 was similar support the broke and broke hard. It now needs to hold $70 or else silver could test $50 which could really open up the trap door if it were to fall.
Bottom line, the technical damage has been pretty ugly in the last few days. What had been a good looking consolidation pattern broke down in a massive way. It’s critical the new support levels hold and it would be good to see a quick turnaround, but that seems unlikely.
Outlook: Bearish
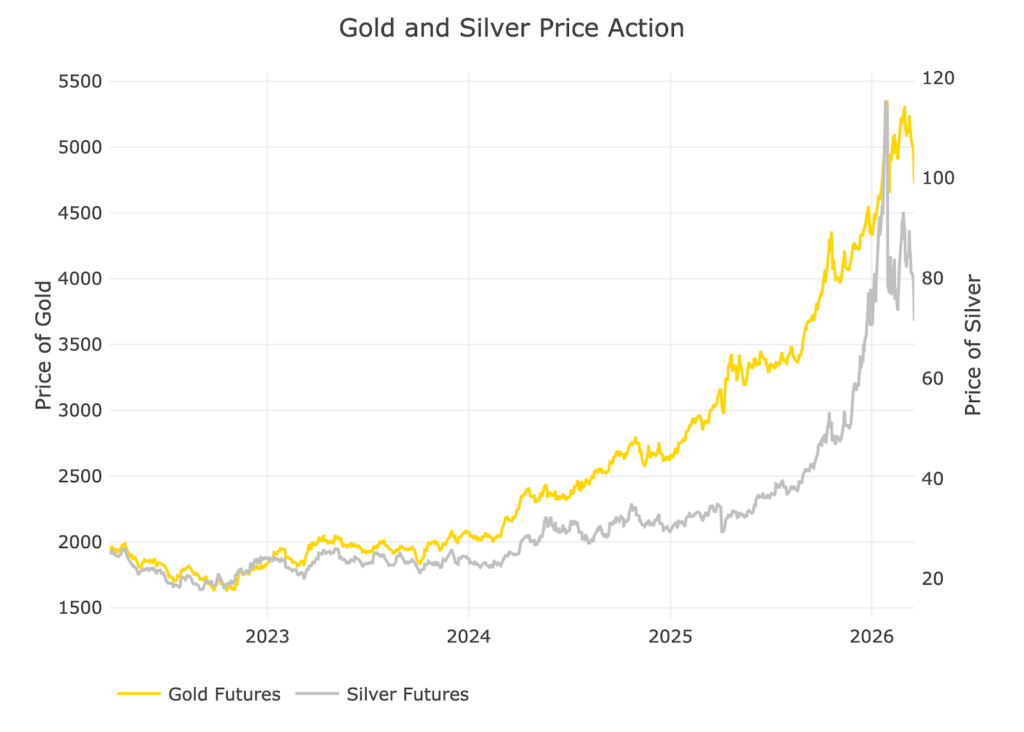
Figure: 1 Gold and Silver Price Action
The log chart paints a picture that looks slightly closer to 2005 than 2011, but it’s not totally clear. A repeat of 2011 would not be fun. But the consolidation pattern between 2011-2023 is unlikely to be over in 2 years. It’s more likely that it has set up a multi-year bull run given how long both metals consolidated for.
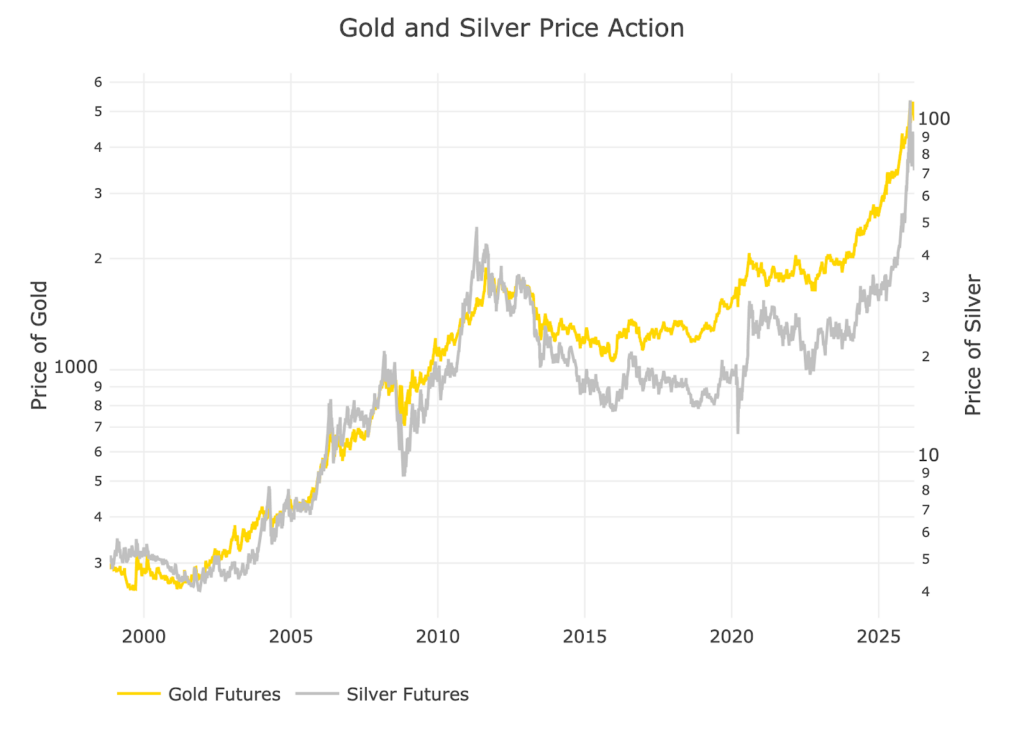
Figure: 2 Gold and Silver Price Action
Daily Moving Averages (DMA)
Gold
The price of gold fell below the 50 DMA on the most recent trading day. The 200 DMA support is all the way down at $4,000. Gold has not fallen below the 200 DMA since October 2023. Since then, every dip below the 50 DMA has created a consolidation phase. This is likely why the $5,000 price couldn’t hold. The true consolidations have happened at the breach of the 50 DMA and the market might have been looking for that. It would be healthy if gold is able to hold here for a bit.
Outlook: Neutral
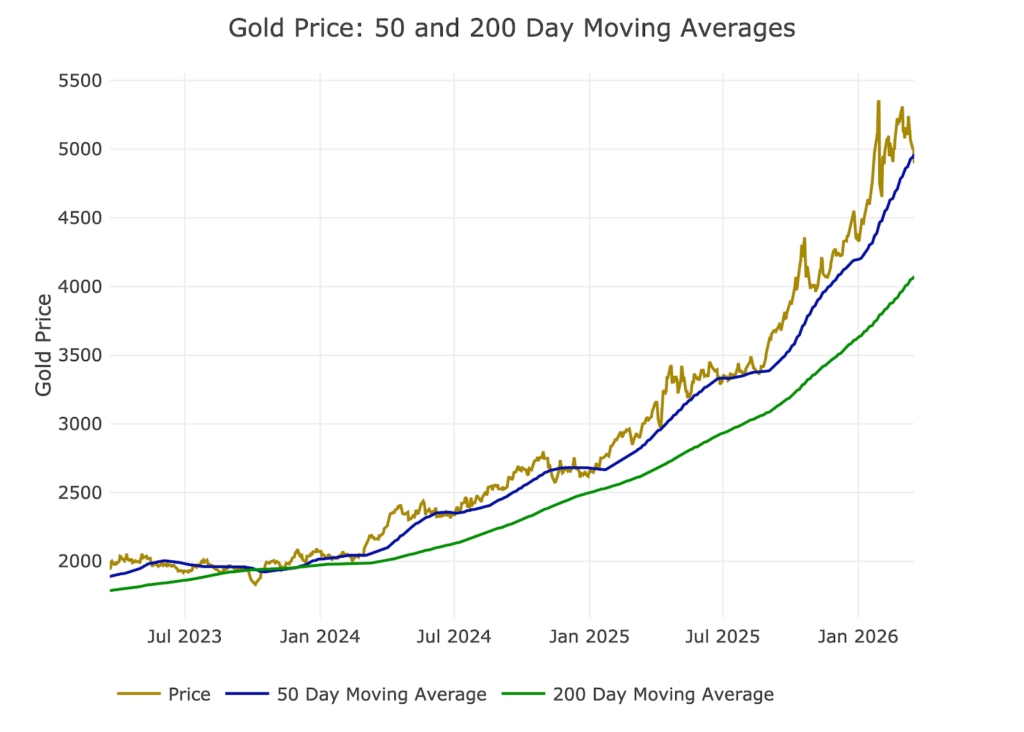
Figure: 3 Gold 50/200 DMA
Silver
Silver got way too far away from both averages. The current price action is absolutely essential to let the moving averages catch up. Silver also was trying to hold around the 50 DMA in the mid 80s but did not have the energy. It has dipped below, but this has been less deadly than gold in the past. The 200 DMA getting above $50 (the old triple top), is a major deal.
Outlook: Neutral
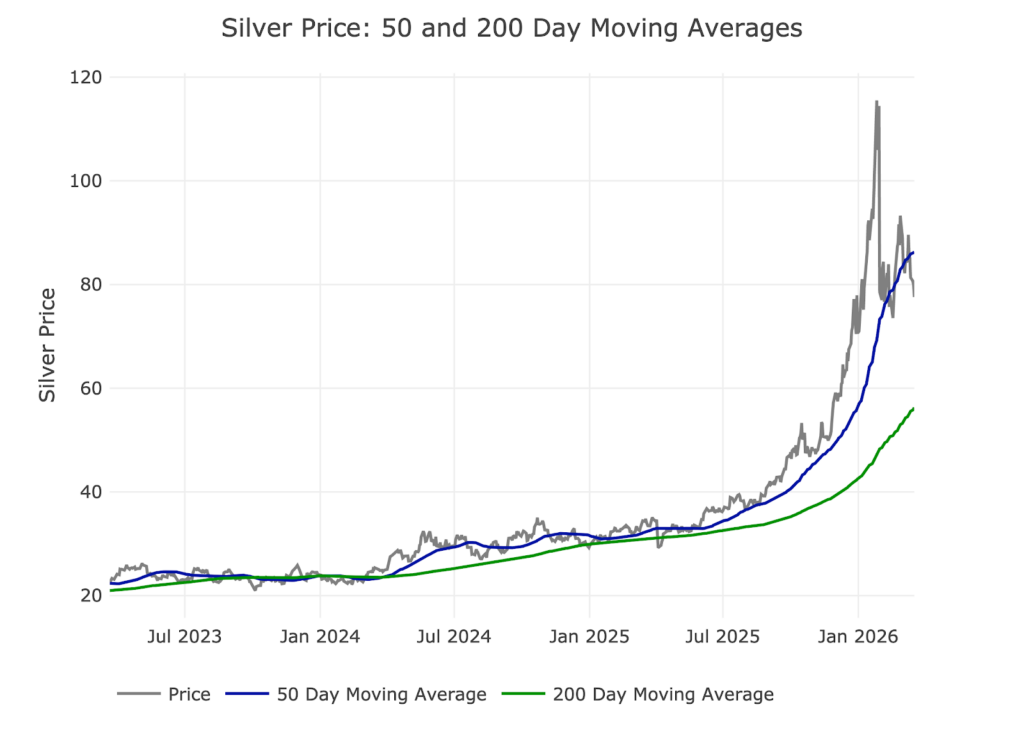
Figure: 4 Silver 50/200 DMA
Comex Open Interest
Gold
Part of the wash out could definitely be tied to the massive drop in open interest.
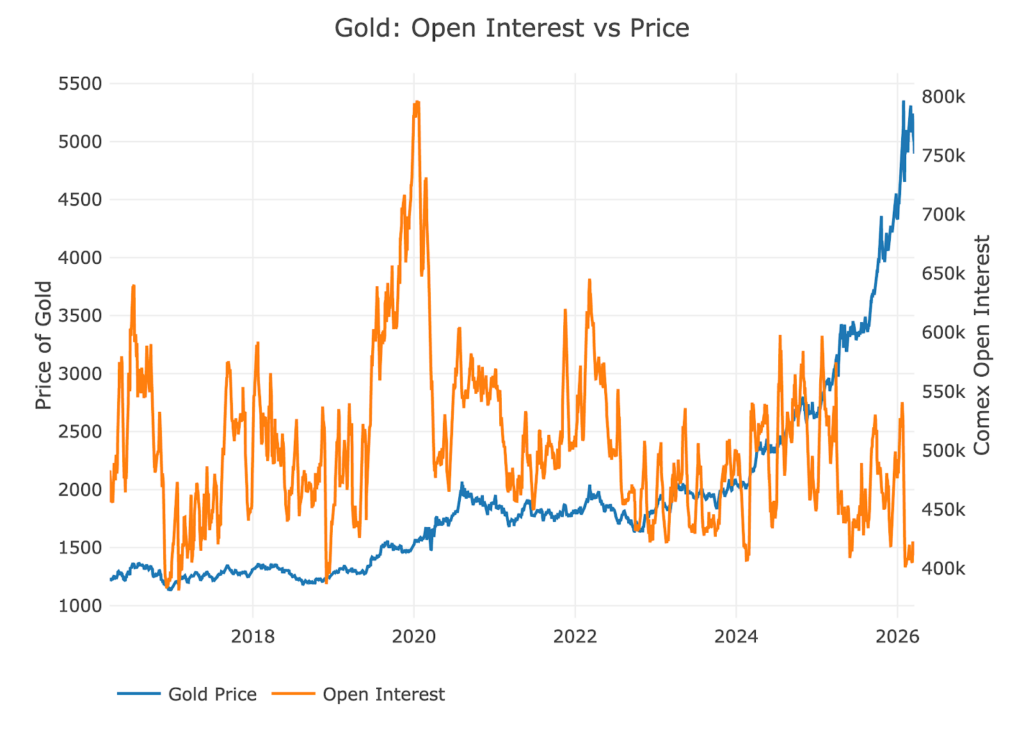
Figure: 5 Gold Price vs Open Interest
That said, on a notional level (factoring in price), the amount remains highly elevated. Notional exposure was around $100B for several years and now sits at $200B. This is high, but with open interest so low it’s likely that most of this is not hot money.
Outlook: Neutral to Bullish
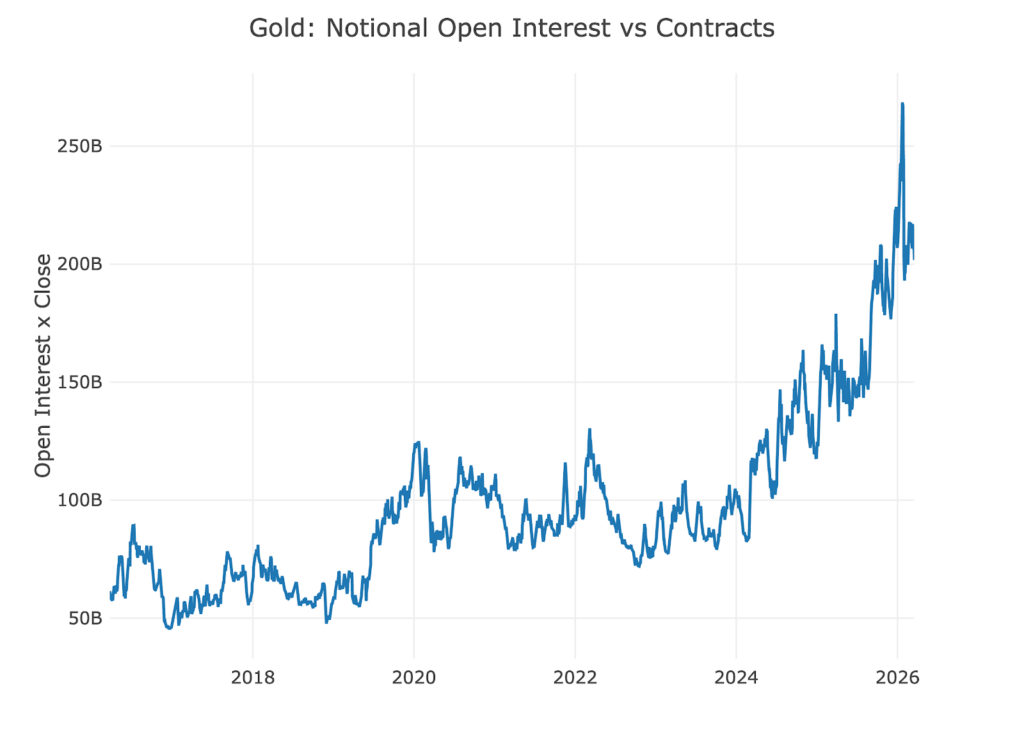
Figure: 6 Gold Notional Open Interest
Silver
Silver open interest has taken a massive dive, even bigger than gold. This is another good sign of speculative flush outs.
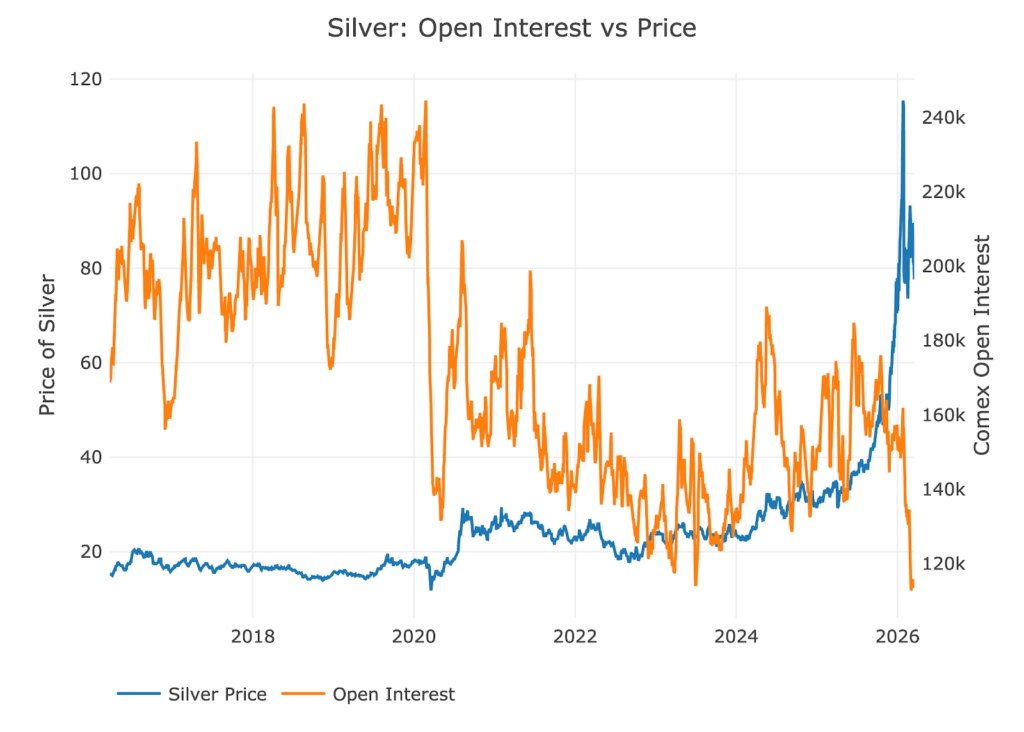
Figure: 7 Silver Price vs Open Interest
Similar to gold, silver saw an explosive move in notional exposure despite a collapse in open interest. It’s now more than double the $20B it sat at for years, but is well below the explosive recent top at $93B.
Outlook: Neutral to Bullish
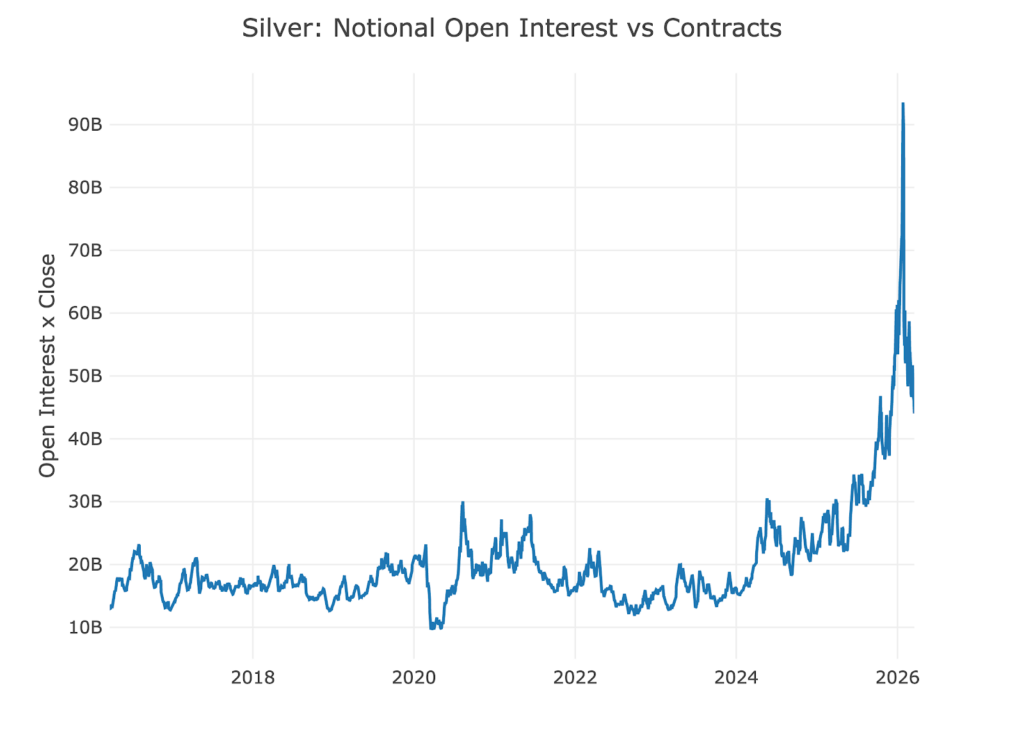
Figure: 8 Silver Notional Open Interest
ETF Shares Outstanding.
GLD and SLV are the two most popular ETFs that track Gold and Silver. While institutions will buy these funds, this data generally shows retail interest. The chart shows the price and shares outstanding. Shares outstanding is the metric that shows overall retail interest.
Gold
Retail is starting to get on board, but they are below the positioning from 2022 and well below 2010-2012 and 2020. This does not show any sort of speculative fever. There was steady buying throughout all of 2025 but it was never a massive spike. There are other ETFs out there (PHYS, OUNZ, SGOL, IAU, etc), but GLD is the bell-weather.
Retail usually marks the end of the party and we are simply not there. This was steady buying over the past year. The buying looked very different when compared to previous accumulation periods. It was steady growth and less spikey.
Outlook: Bullish
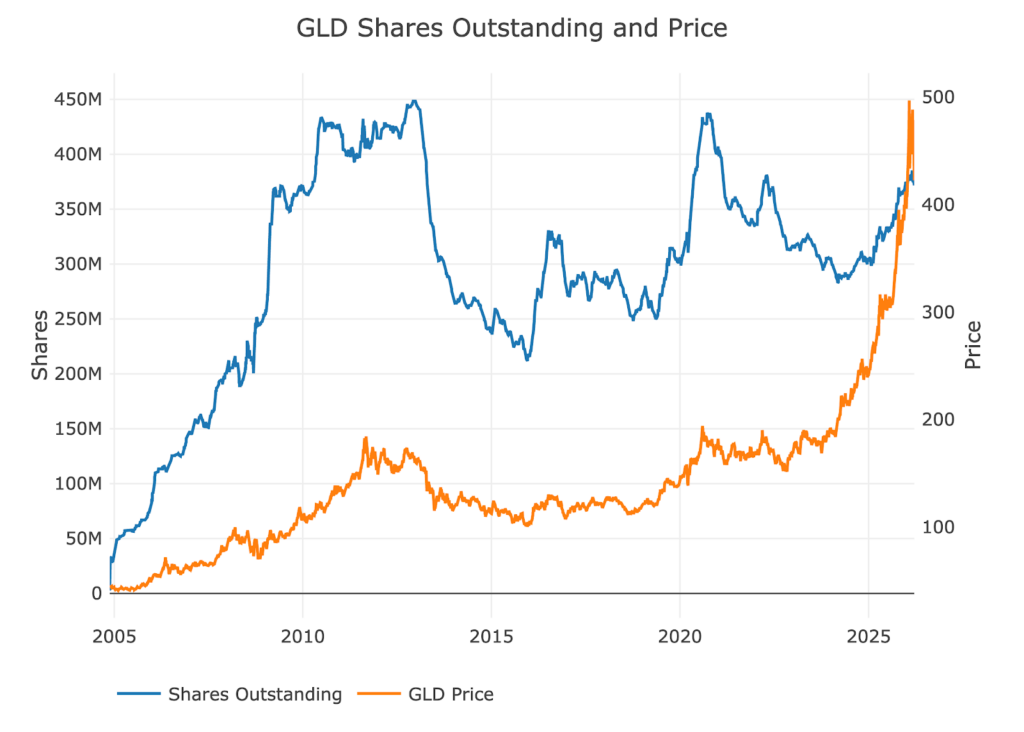
Figure: 9 ETF Analysis
Silver
SLV is in a very similar boat. Steady accumulation over the last year, with very mild liquidations over the last few weeks. This is not a retail frenzy. This is a steady and slow accumulation which is less likely to exit quickly.
Outlook: Bullish
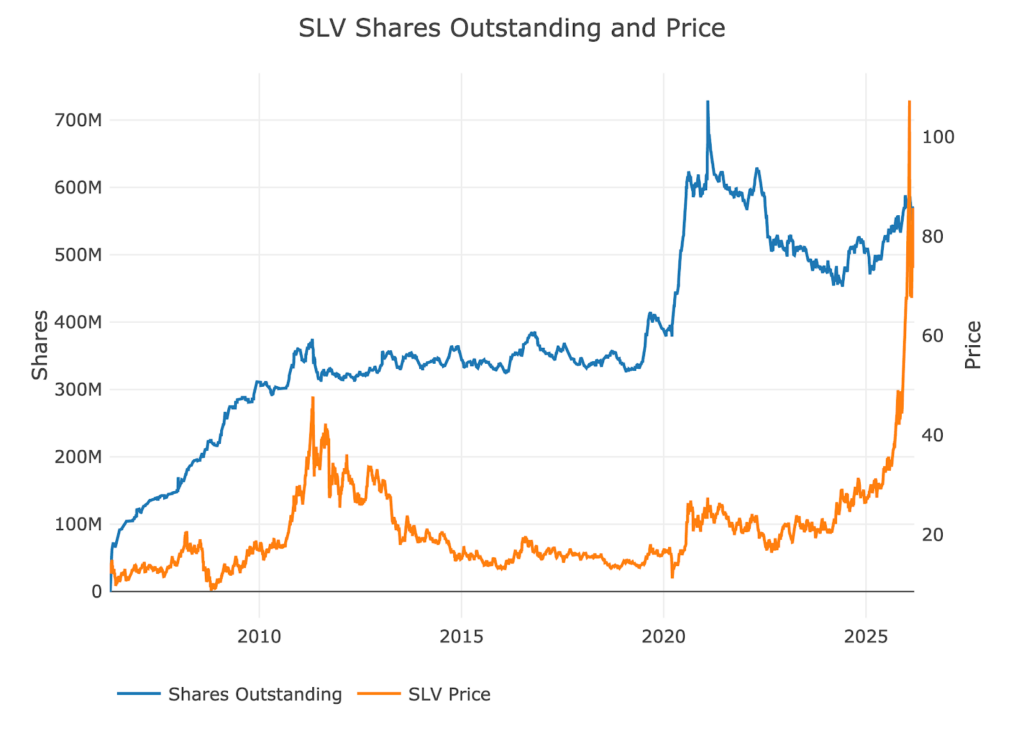
Figure: 10 ETF Analysis
Margin Rates and Open Interest
The CME uses margin requirements to pull momentum out of the futures market. This is usually done to halt explosive up moves and contain them, but can be used in quick bear markets as both shorts and long are subject to margin requirements. A few months ago, the CME changed their margin requirements from fixed dollar amounts to a percentage basis. This would allow the market to be self adjusting during big moves.
The change in margin definitely had the desired effect to flush out the hot money.
Gold
Margin rates have sky rocketed to their highest level on record. This is the single biggest reason open interest has collapsed. It is more expensive to get exposure. At the same time, this means the price will be set less by the CME futures market and more by the physical market. Overall, this will be extremely bullish for gold.
Outlook: Bullish
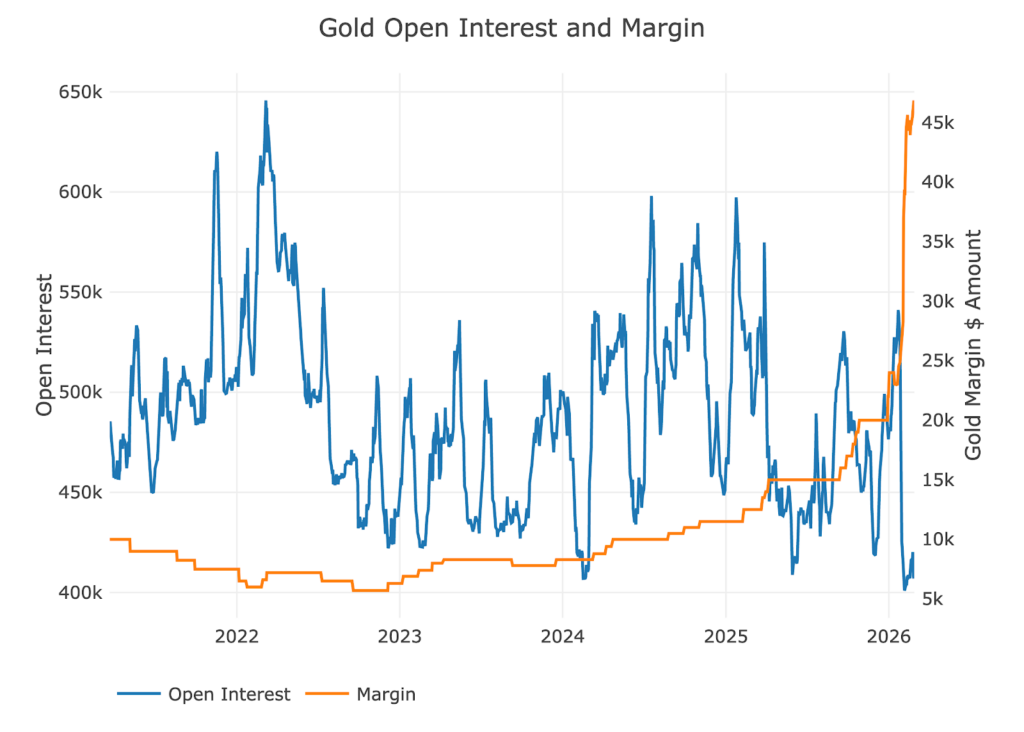
Figure: 11 Gold Margin Dollar Rate
Silver
Almost the exact same thing has played out in silver. A massive spike in margin has led to a significant drop in open interest. Hot money creates volatility with fast entrances and exits. Getting the paper metal out of the market is long time bullish for silver. In paper markets, supply is infinite. In physical markets, it is not.
Outlook: Bullish
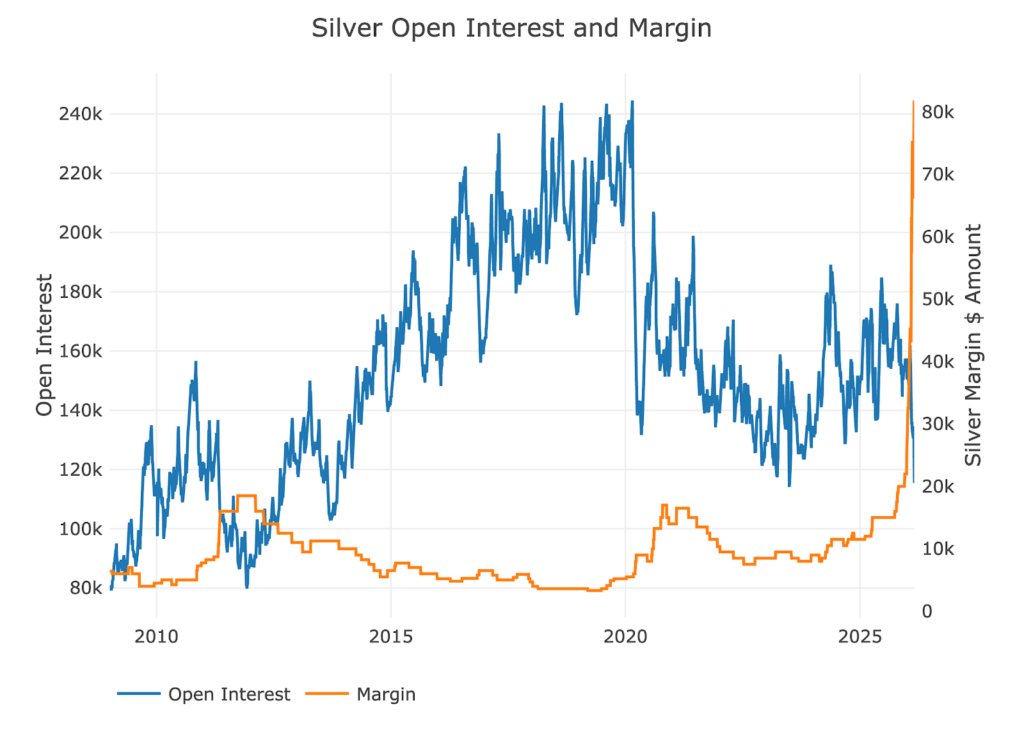
Figure: 12 Silver Margin Dollar Rate
Gold Miners
The miners represent the long-term investors in the gold market. When GLD falls 3% and miners drop 8%, and when GLD climbs 3% and miners climb 2%… it tells you that the equity investors are terrified that the gold price is unsustainable. GLD has been dragging GDX along with it for years, with GDX mostly lagging.
In August, GDX finally started to catch-up and actually make gains on GLD. But it has given up almost all of those gains. The miners have led the moves in the underlying metal. In January, the miners were showing weakness at the end of the month, even while the metals were making new ATHs. Just this week, the miners were leading the metal down. According to this chart, it looks like the equity investors have thrown in the towel. This is similar to what happened in November which then set up the next leg in the bull market. Will the current levels hold and reverse? That would be a bullish setup. If miners keep falling, it could indicate a move towards $4,000 is incoming.
The next move in the miners will foreshadow the next move in the metals. This has been a consistent theme.
Outlook: Neutral
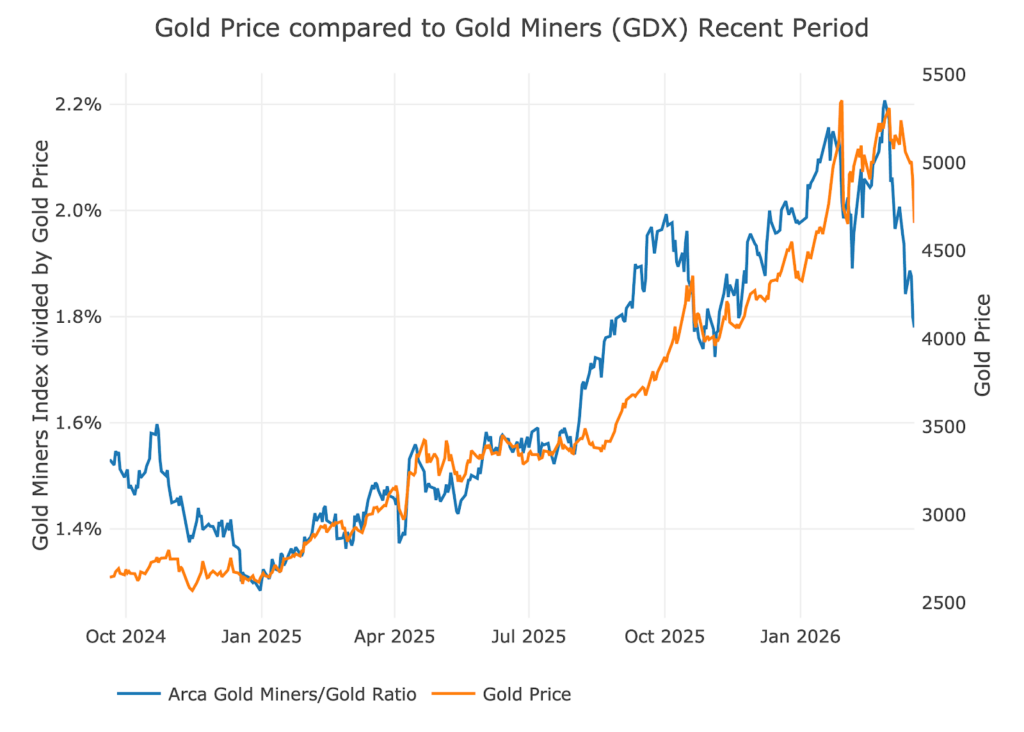
Figure: 13 Arca Gold Miners to Gold Current Trend
While the micro level does have the miners leading the metals, the long term chart shows a sector that has fallen way out of love with the miners. The miners still have room to triple from here even if gold just holds where it is.
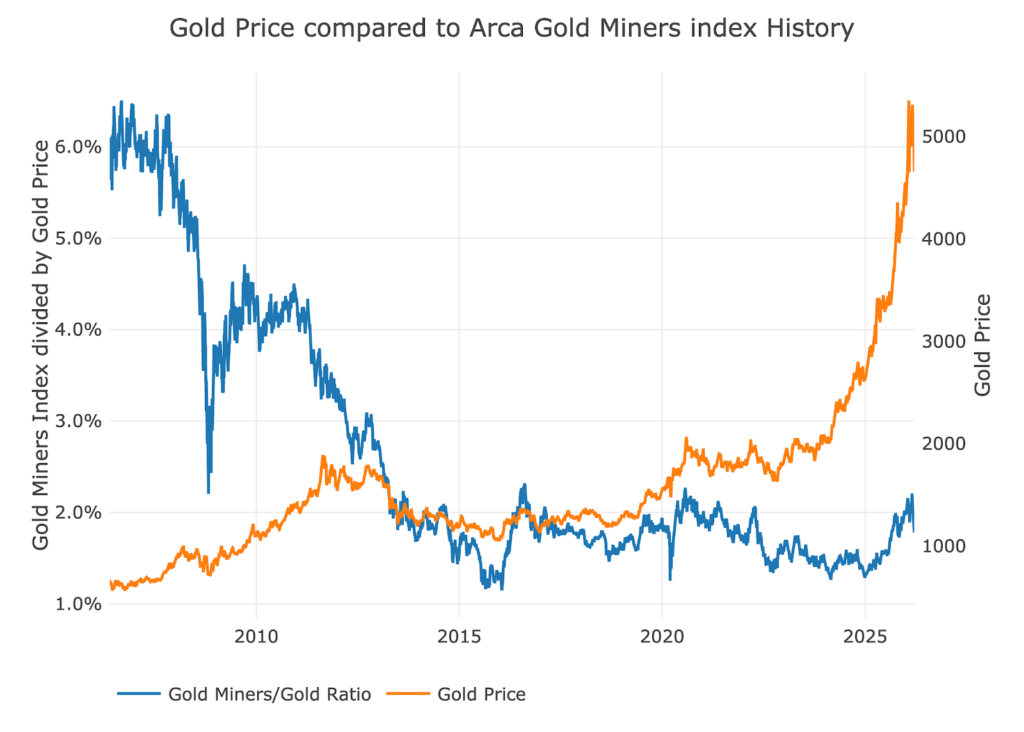
Figure: 14 Arca Gold Miners to Gold Historical Trend
Trade Volume
The next indicator is trade volume on the CME. This is related to, but not exactly tied to open interest. Higher trade volume with flat open interest can mean churn. Higher trade volume can also be met with increases or decreases in open interest if buyers or sellers are in control.
In gold, trade volume has dropped dramatically. This is more evidence that the hot money is leaving the sector. This usually lays the groundwork for the next leg up.
Outlook: Bullish
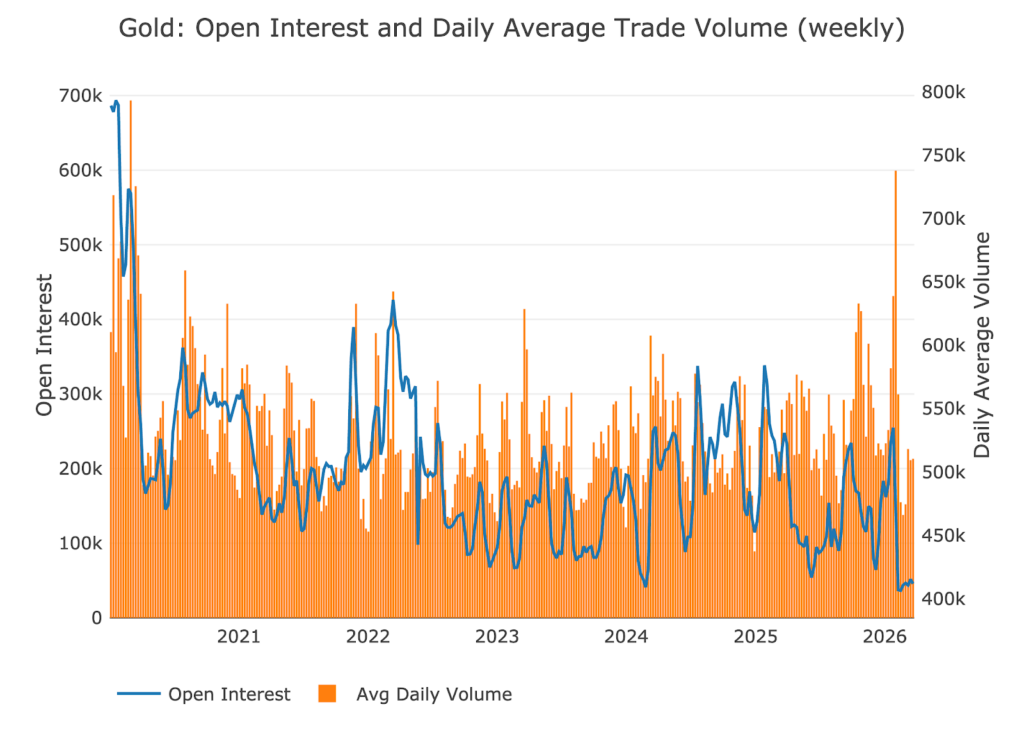
Figure: 15 Gold Volume and Open Interest
Silver trade volume has plummeted. Again, this is likely a good sign. The less action is happening on Comex means the market is moving towards pricing off physical. This will deliver higher and more stable prices over time.
Outlook: Bullish
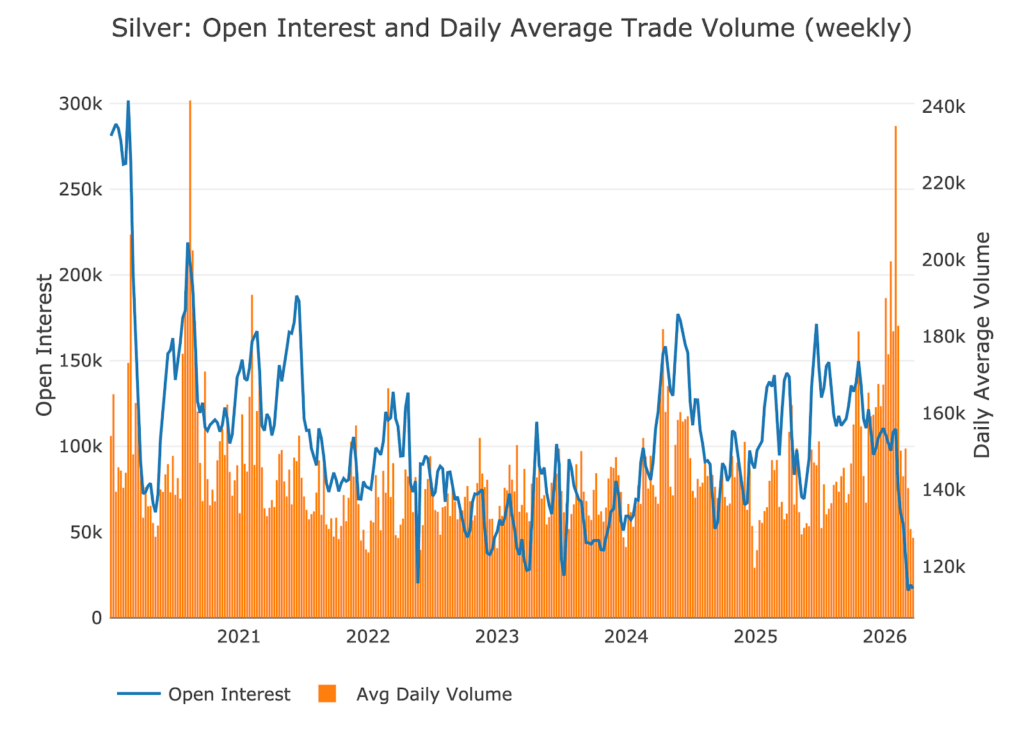
Figure: 16 Silver Volume and Open Interest
Other drivers
USD
Price action can be driven by activity in the US Dollar exchange rate. A big move up in gold will often occur simultaneously with a move down in the US dollar. The dollar is still hovering near 100 which is on the higher side over the last 20 years. The war in Iran has created a small rally in the Dollar, but less so than history would indicate.
Gold and silver have definitely been hit by the stronger dollar in recent weeks. That said, the lack of the DXY to really spike with the war in Iran indicates the world is moving away from the Dollar. This means gold will become the new global currency of the world as central banks continue to buy.
Outlook: Bullish
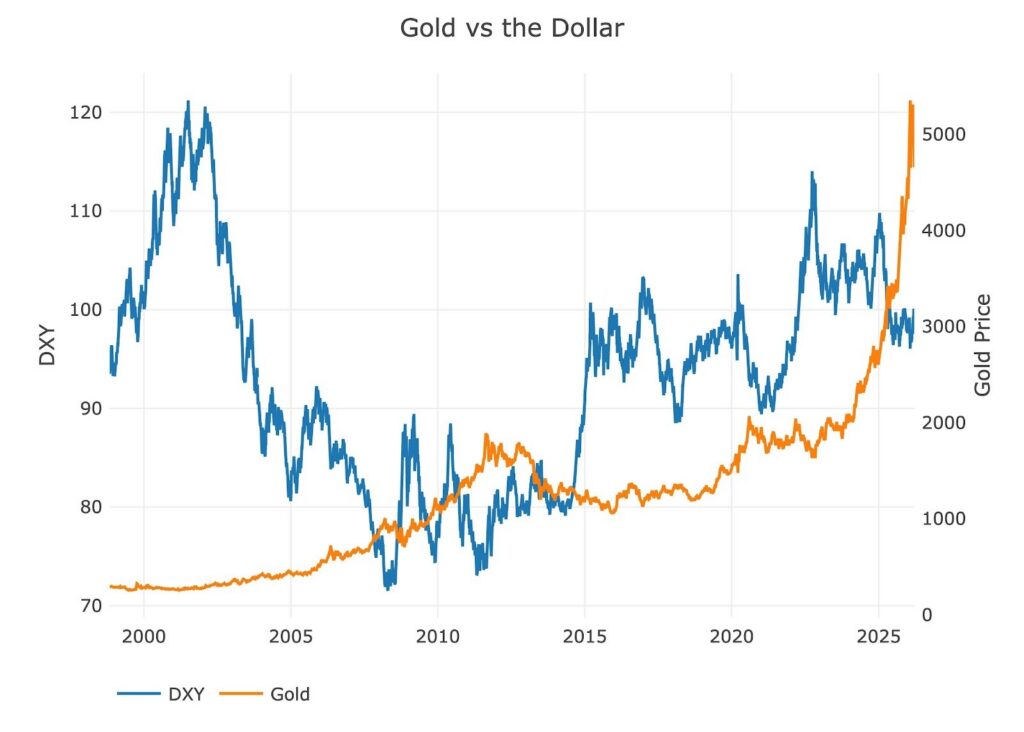
Figure: 17 Price Compare DXY and GLD
Gold Silver Ratio
The gold silver ratio collapsed as silver spiked. It went too far too fast. It is still in silvers favor compared to the last several years but this has been overdue. It’s likely this is not a one-off event and that the gold/silver ratio will likely come back in line to historical trends which is more in the $40 range.
Outlook: Neutral
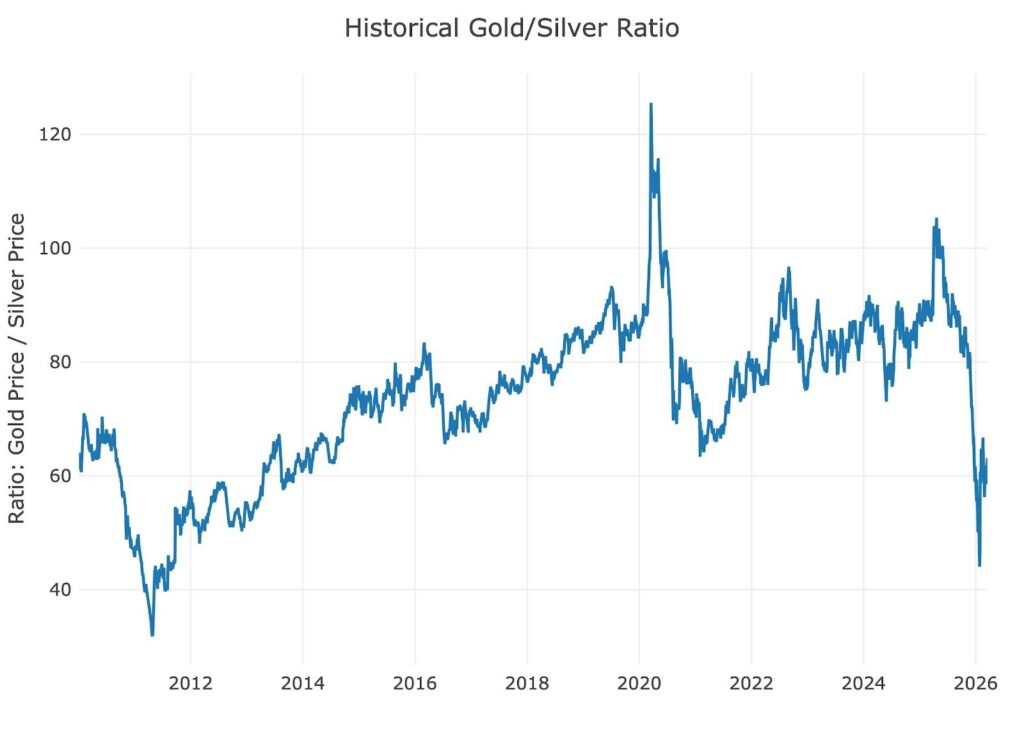
Figure: 18 Gold Silver Ratio
Gold Volatility Index
The GVZ is like the VIX for gold. It shows how the options traders are pricing the gold market. Right now, the indicator is coming back down after a massive spike. It would be good to see the implied volatility continue to fall.
Outlook: Neutral
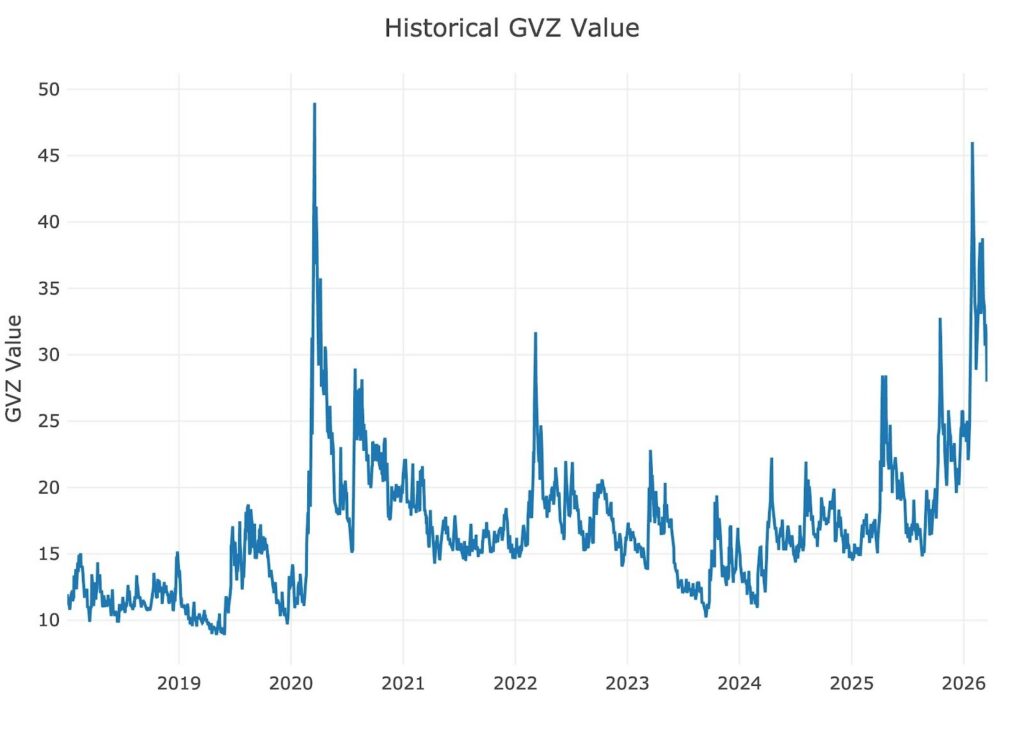
Figure: 19 Gold Volatility Index (GVZ)
Conclusion
The technical analysis is a bit mixed. The price action is getting the consolidation it needs, but both metals also look vulnerable. This is very typical for consolidation patterns. To get the true flush out of speculative money, the resolve of the bulls needs to be tested. 20-30% corrections in the metals is very normal and very healthy. It still does not look like 2011 is about to repeat, but both markets may be months away from new all time highs even if you are bullish.
Most likely, silver will not make a new ATH in 2026. Gold is possible but it needs to hold here and then start mounting some positive momentum by summer. Silver has too much wood to chop on the way up to $120.
