
Comex Update: Delivery Activity Goes Deathly Quiet
The CME Comex is the Exchange where futures are traded for gold, silver, and other commodities. The CME also allows futures buyers to turn their contracts into physical metal through delivery. You can find more detail on the CME here (e.g., vault types, major/minor months, delivery explanation, historical data, etc.).
The data below looks at contract delivery where the ownership of physical metal changes hands within CME vaults. It also shows data that details the movement of metal in and out of CME vaults. It is very possible that if there is a run on the dollar, and a flight into gold, this is the data that will show early warning signs.
Gold
We have been tracking this data for years now. Since January of 2025, the market has seen significantly elevated delivery volume far surpassing what had been seen in years past. However, three of the last 4 major months have seen a major drop in activity and volume. October is always a tricky month. December is the true major month near year end, but to bridge the gap between August and December there is elevated volume but it is not usually as busy as a normal major month.
The reason the orange dot in the chart below is higher than the others is because the open interest during the month never gets nearly as high as the major months. This October volume of 13.5k was a bit higher than the 12.7k seen in October of 2024. However, it pales in comparison to 58.8k seen last October. That is a massive difference showing just how much physical demand there was last year compared to this year.
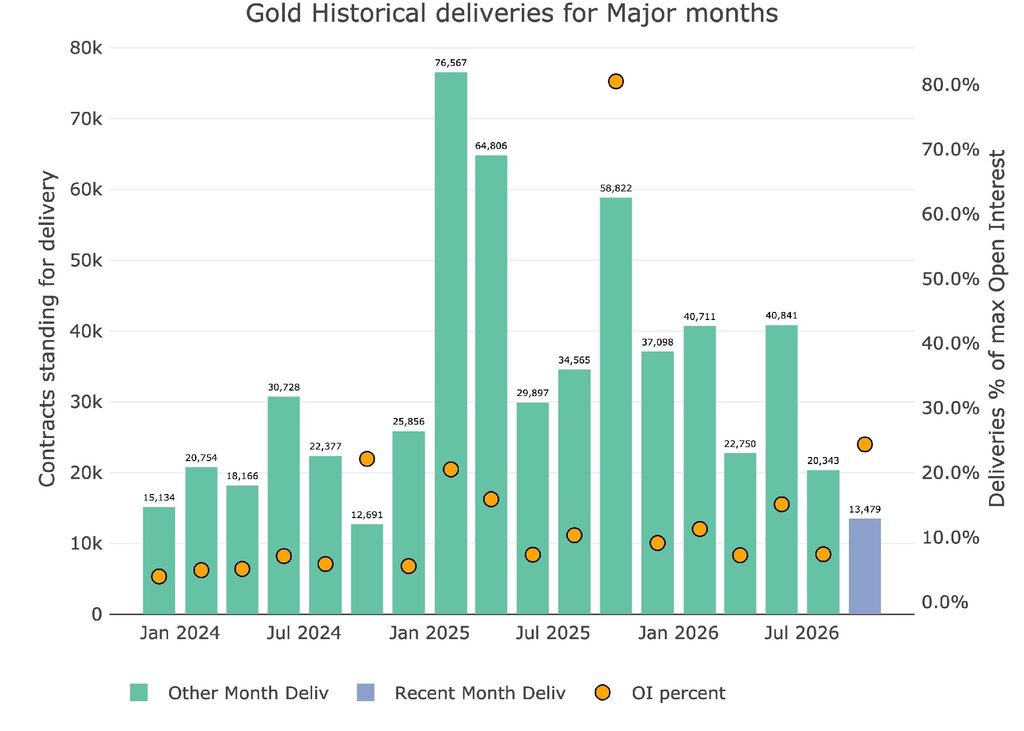
Figure: 1 Recent like-month delivery volume
When looked at from a dollar amount perspective (rather than raw ounces), you can see just how much bigger October was last year despite a similar price. In fact, even October 2020 was busier than this year, and that considers the fact the price back then was half the current price.
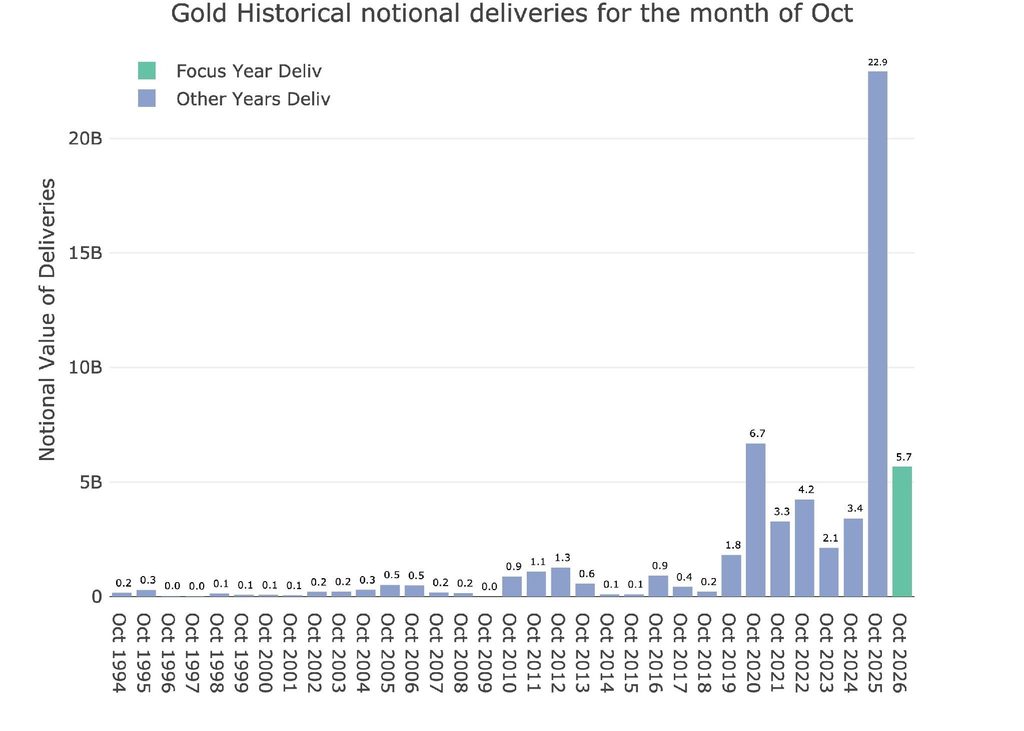
Figure: 2 Notional Deliveries
Net new contracts (contracts that open and settle for immediate delivery) are at the lowest level in two years, barely getting above 1,000.
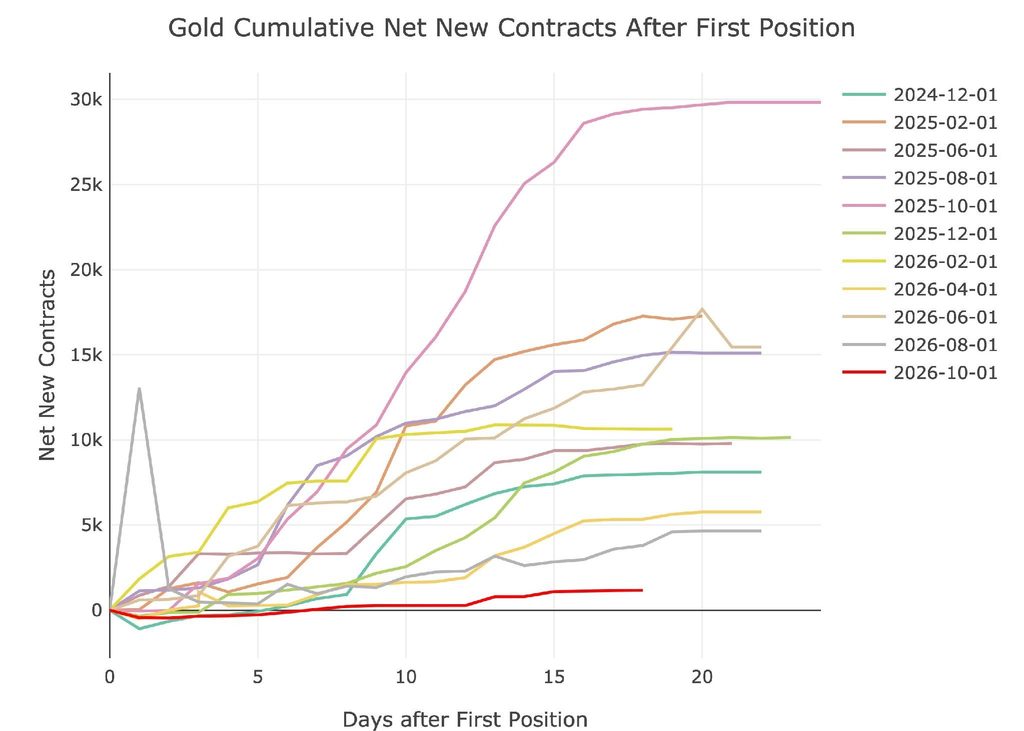
Figure: 3 Cumulative Net New Contracts
Here is the more interesting chart of the group. During the gold delivery surge that occurred in 2020, the Comex needed to add metal fast. To accomplish this, they opened up a 400 ounce contract and brought on vaults holding 400 ounce bars which are the London LBMA standard. This was done to give confidence to the market in a period of stress. However, the 400 ounce gold contract on the Comex was a dead contract with 0 open interest. Thus, the Comex shut down the contract last month and removed those vaults holding 400 ounce bars.
Since the removal, inventories have climbed some. You can see how this breaks from trend where inventory levels were getting seriously depleted from April 2025 to about August 2026.
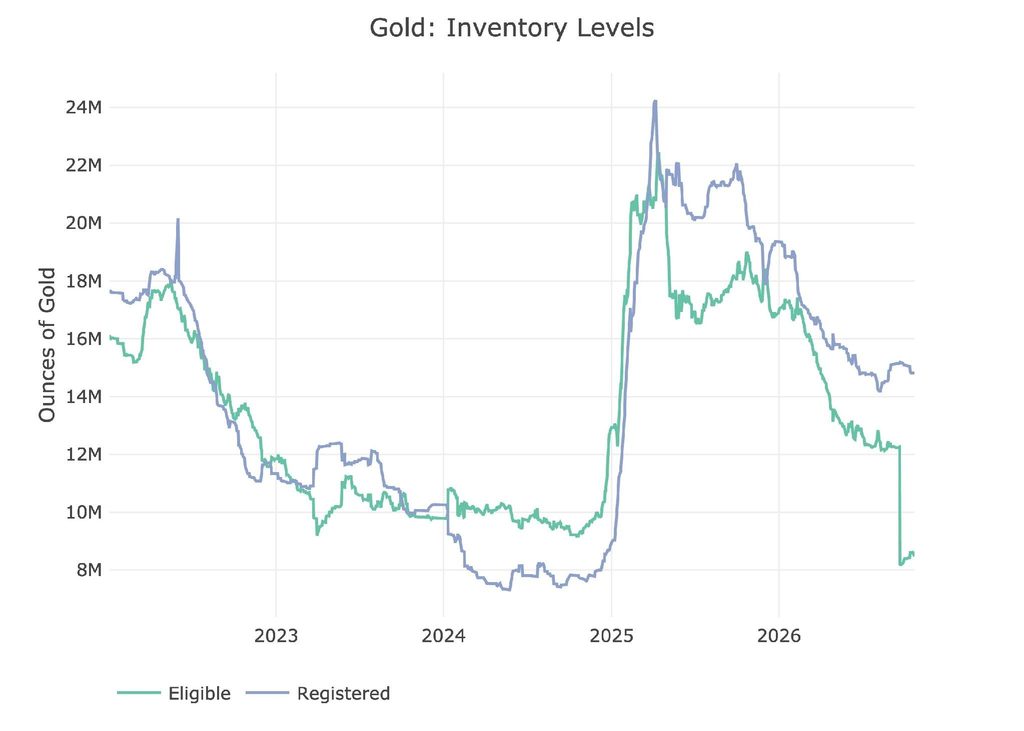
Figure: 4 Inventory Data
Looking ahead to the November delivery period (a minor month for gold), we see a contract that is at the lowest level in years. November is the smallest of minor months, but this is still historically low.
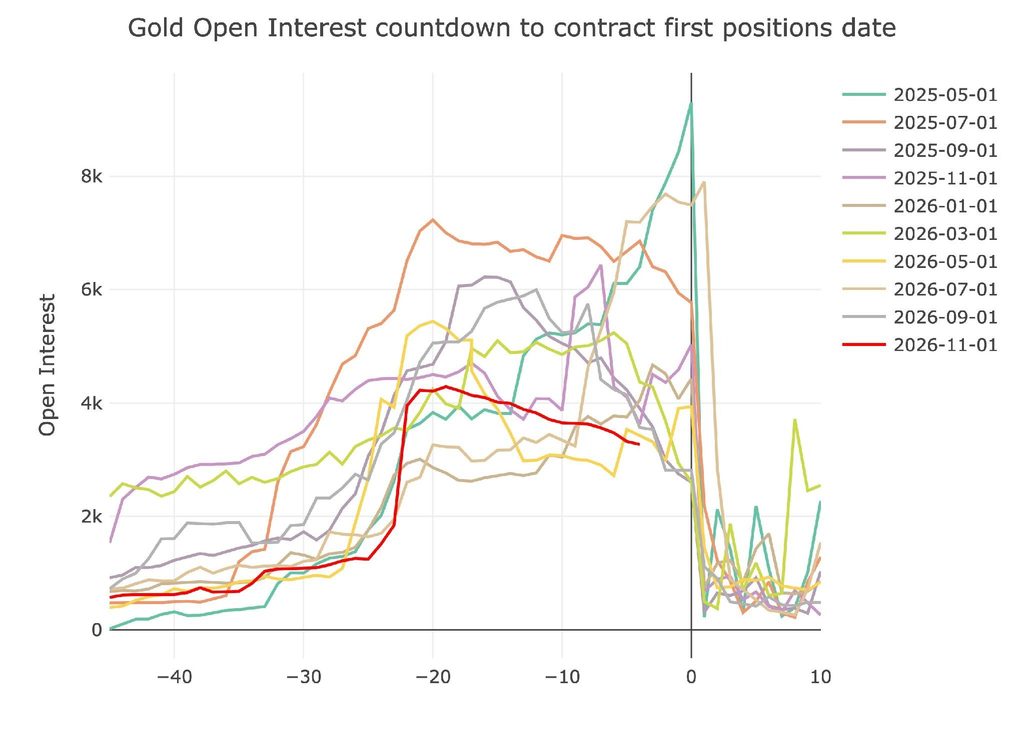
Figure: 5 Open Interest Countdown
Even on a relative basis, the demand is looking rather weak.
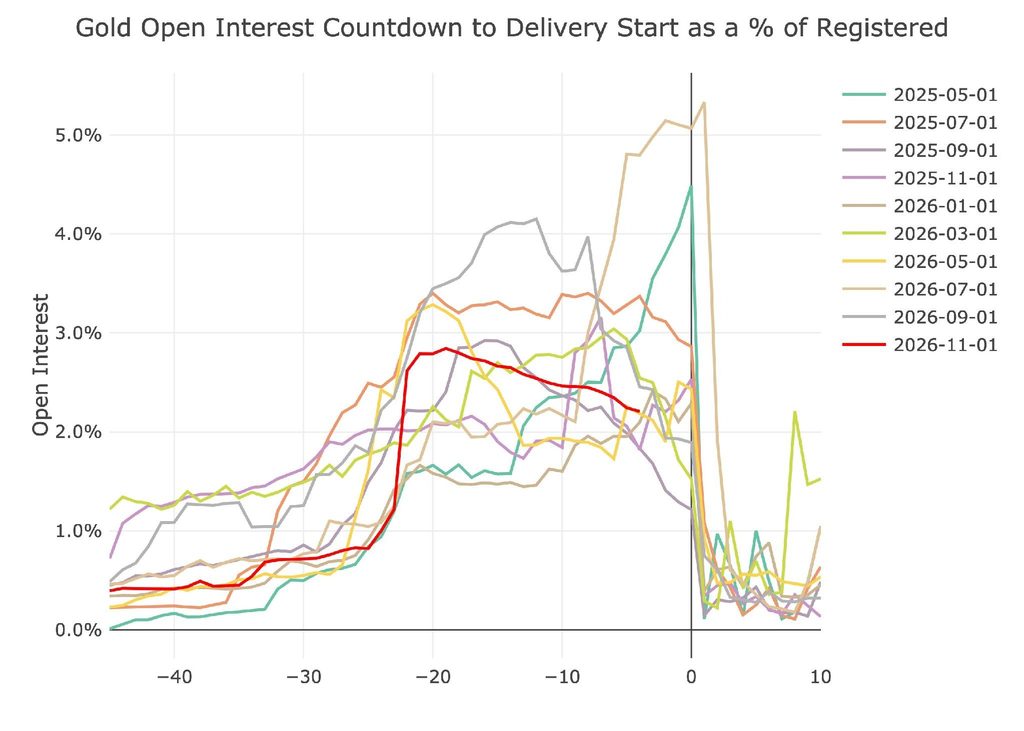
Figure: 6 Open Interest Countdown Percent
Bottom line, delivery volumes have plummeted and the exodus of gold from Comex vaults has paused and even reversed some. It is not surprising to see the gold price continue to fall when there is no bid in the physical market at all.
Silver
Silver price spreads have completely normalized when compared to where they were for a year ranging from Jan 2025 to Feb 2026.
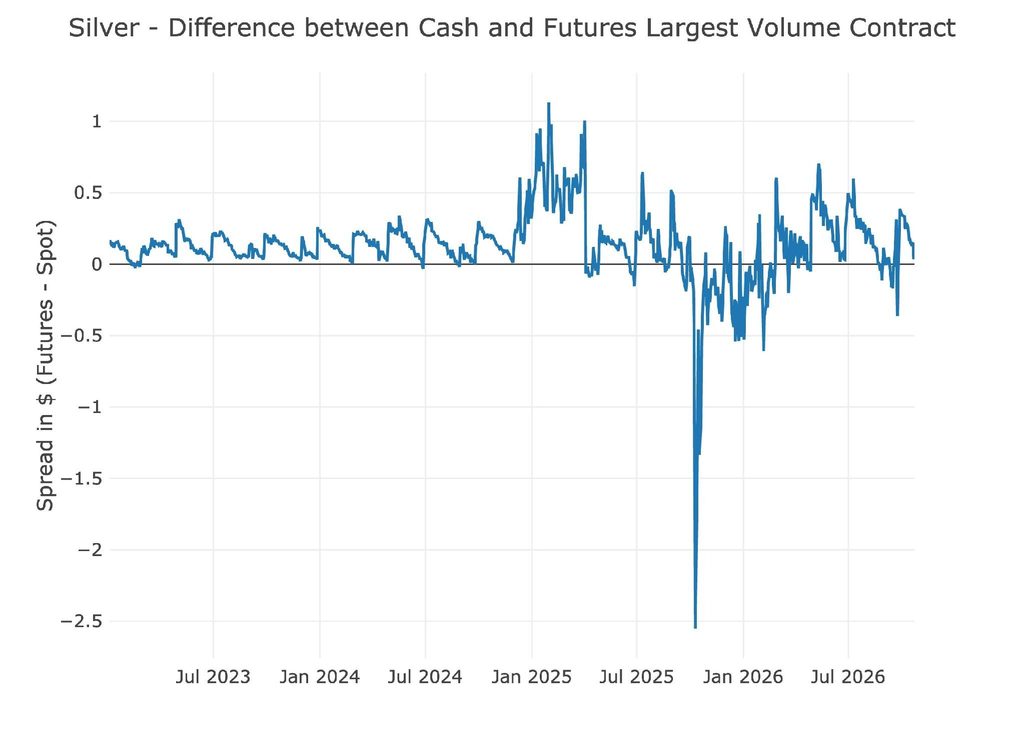
Figure: 7 Spot vs Futures
October is a minor month in Silver. Delivery volumes have also dropped compared to 2025 but October actually exceeded the last two minor months.
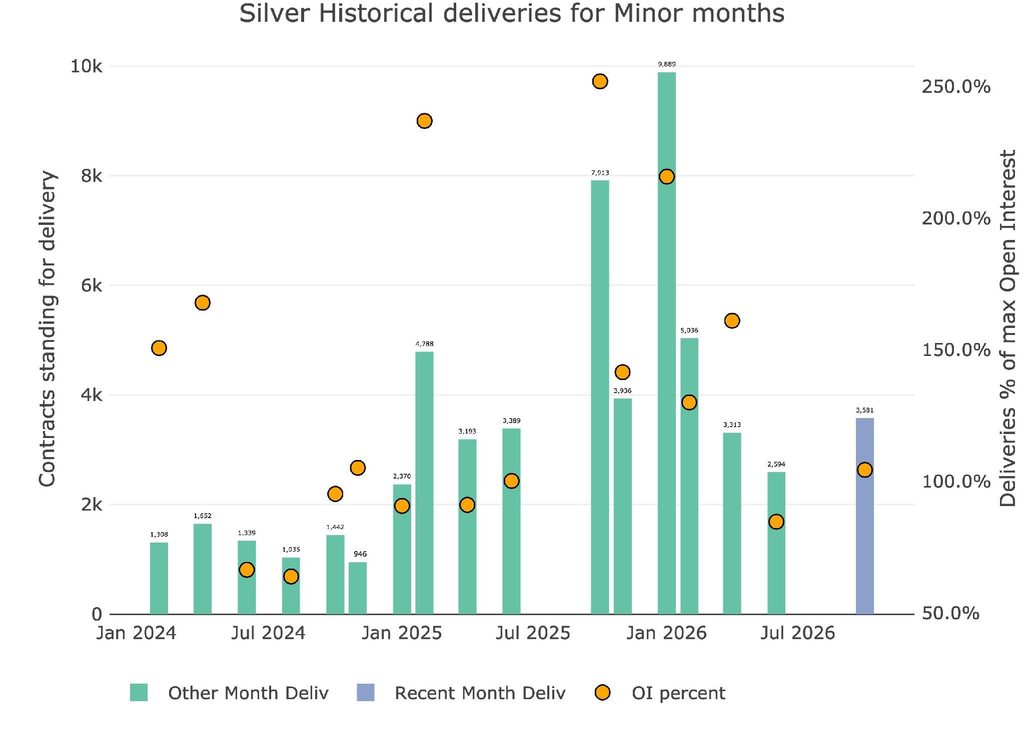
Figure: 8 Recent like-month delivery volume
Notional delivery volume is still elevated but also half of where the value was last October.
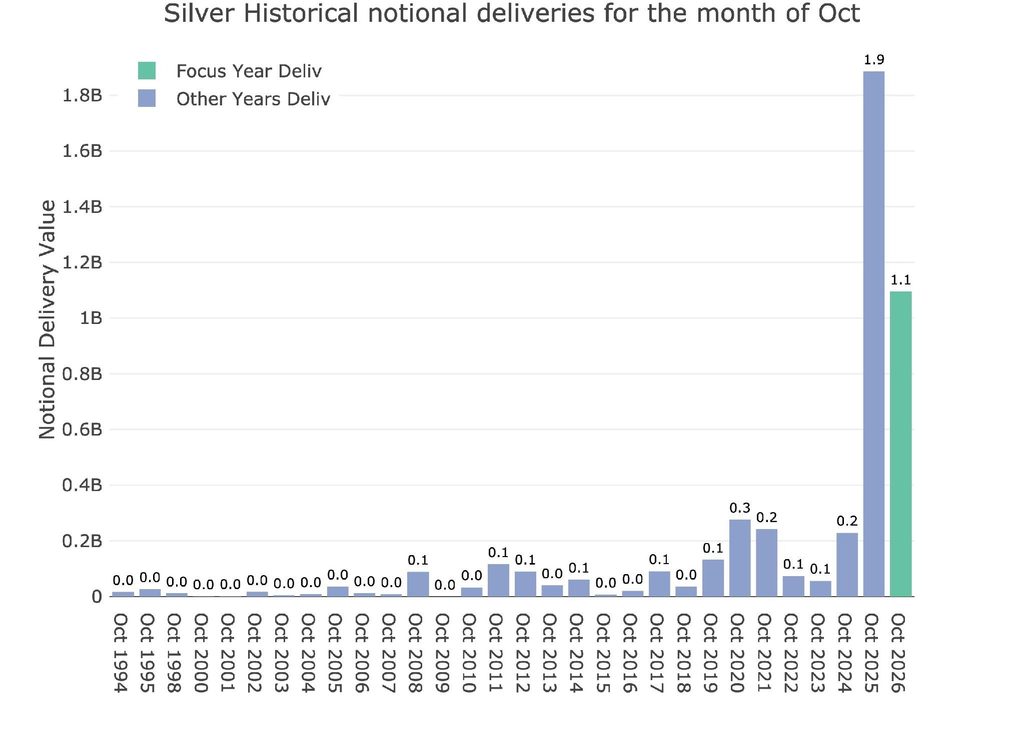
Figure: 9 Notional Deliveries
Similar to gold, silver net new contracts were pretty much negligible.
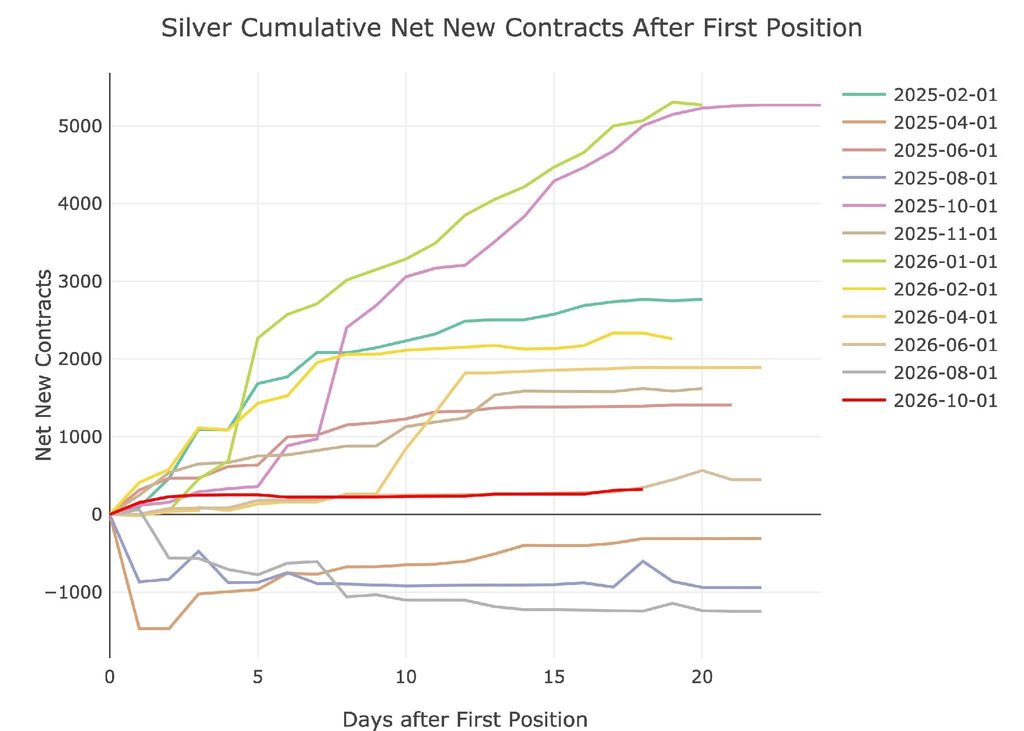
Figure: 10 Cumulative Net New Contracts
Silver inventory has been on a bit of a roller coaster. After a big drawdown in 2025 and early 2026, the exodus stopped on a dime. Since then, Eligible inventory has been pretty much flat.
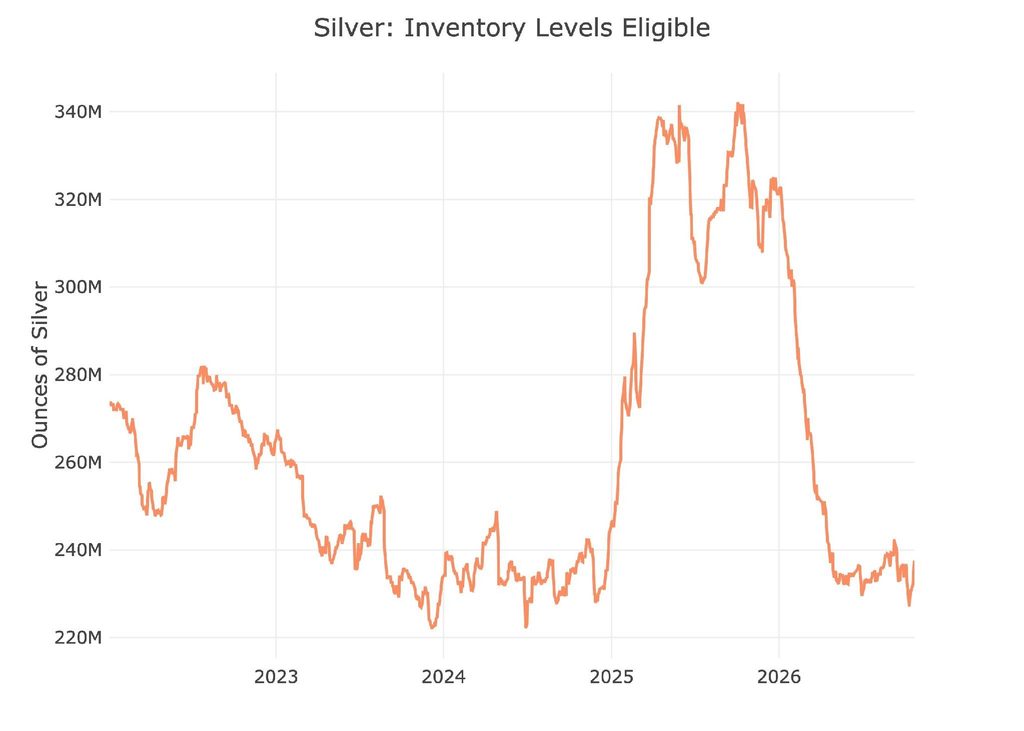
Figure: 11 Inventory Data
Registered metal has actually shown a modest recovery in inventory levels after a significant depletion.
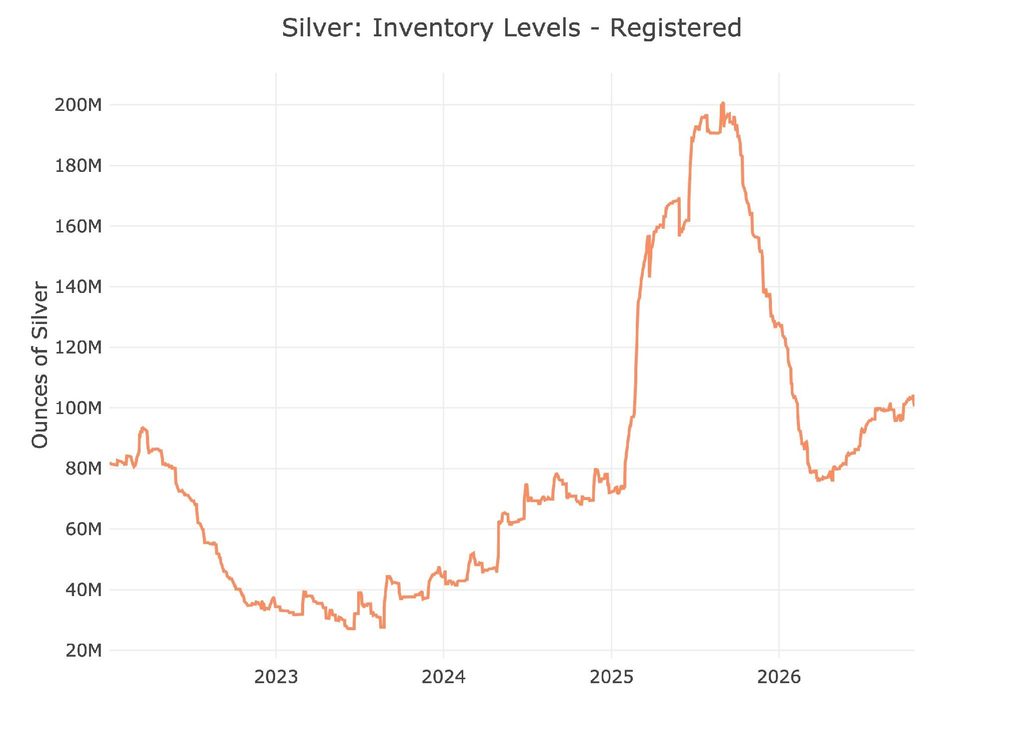
Figure: 12 Inventory Data
As we approach November delivery (minor silver month), we again see a contract that is near multi-year lows.
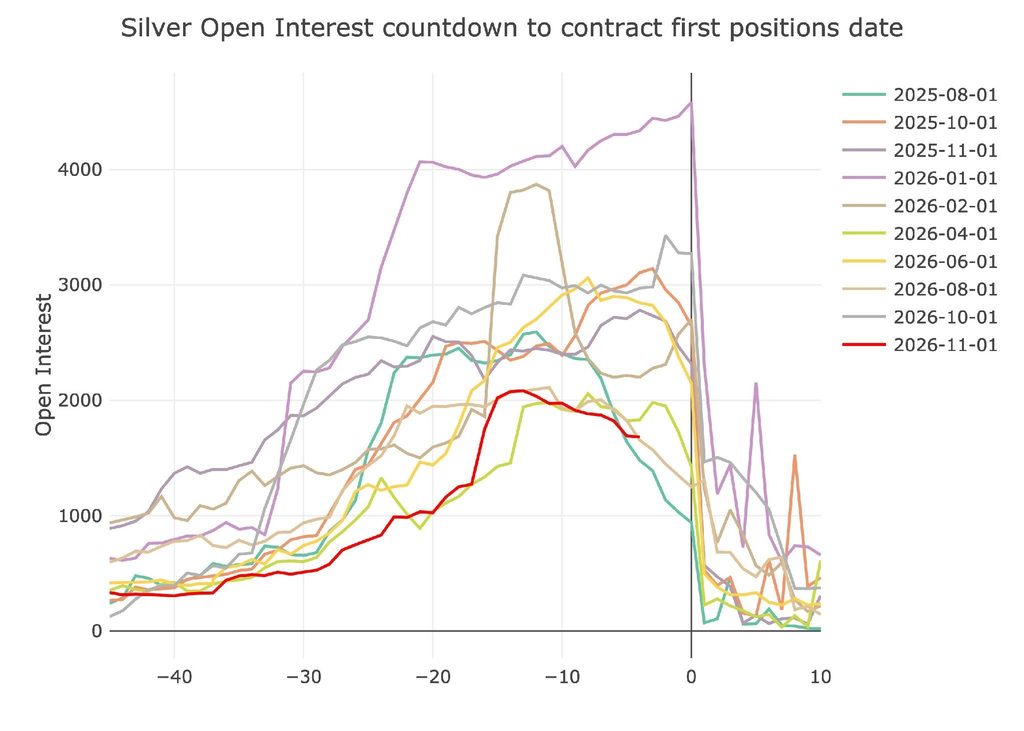
Figure: 13 Open Interest Countdown
On a relative basis, it’s on the lower end of the pack.
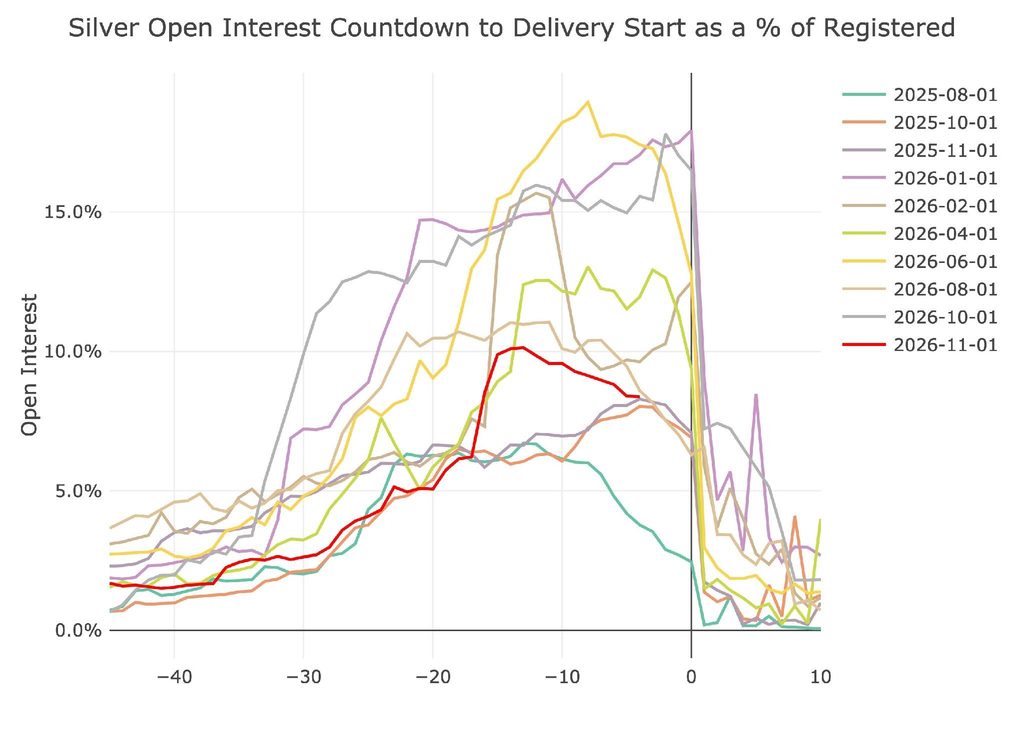
Figure: 14 Open Interest Countdown Percent
Conclusion
When Comex inventory activity started going wild in early 2025, it pre-empted a massive price surge. The physical market was under attack and it put a massive bid under the market. The paper market for gold and silver was unraveling. Inventories were getting depleted, prices were surging, trading volumes were elevated. After the January price collapse, the activity stayed elevated for awhile but has now crashed back to earth.
This is not a good sign for the price of gold and silver as there seems to be no bid in the physical market. It’s possible that some of this is due to Asian markets taking over as the bigger players for physical demand. Comex open interest in general is approaching multi-year lows which also suggests speculators have exited the market as well.
If the Comex is truly losing control over the price of gold and silver, that will be a good sign in the long run. However, until that shift completes the paper price is setting the physical price. And that price does not have a bid at the moment.

Receive SchiffGold’s key news stories in your inbox every week – click here – for a free subscription to his exclusive weekly email updates. Interested in learning how to buy gold and buy silver? Call 1-888-GOLD-160 and speak with a Precious Metals Specialist today!
 Live Chat
 Email:
 Phone: 1-888-465-3160