
August Trade Deficit Surges 77% Year-Over-Year
The Trade Deficit is one of the two components of the ‘twin deficits’; the other being the federal budget deficit. The trade deficit used to be a number that received a ton of attention in the 1980s and 1990s because it was determined to be a strong gauge of the strength and weakness in the US economy. It was last positive in 1975, but big moves in the trade deficit through the 80s and 90s impacted the stock market.
Lately, not many people focus on the trade deficit numbers; however, it is still an excellent metric for identifying how the US is performing. How much more are we consuming than we are producing? It also allows us to export our inflation abroad. If the rest of the world decides to stop making things for us, then it could be an ugly transition.
Current Trends
The August trade deficit came in at -$106B. This is $20B higher than it was when this analysis was last produced only 3 months ago. It is also the largest trade deficit since March 2025 when a new record trade deficit had been recorded. The record last year was being driven by the pending trade tariffs that caused importers to front-load their purchases.
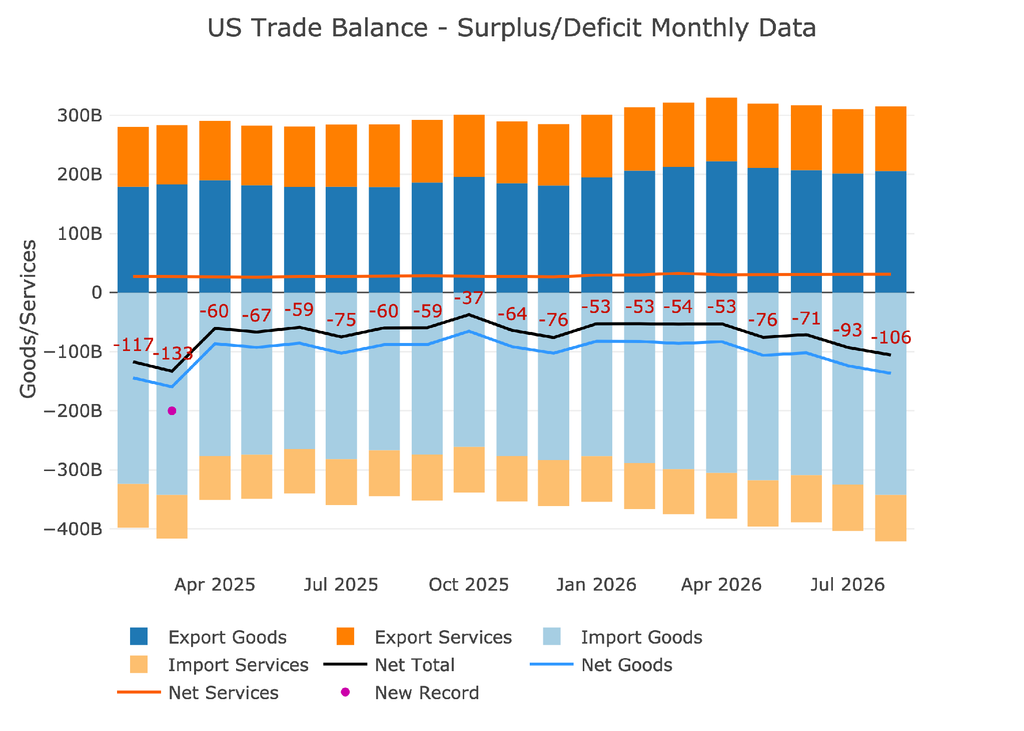
Figure: 1 Monthly Plot Detail
The table below provides detail. On a YoY basis, every single metric increased, but Imports grew much faster than Exports which caused the overall deficit to increase by a whopping 77% when compared to last August. That said, on a trailing twelve-month basis, the deficit in Goods did shrink. As mentioned above, last year was a bit of an anomaly due to the massive inventory buildup before the tariffs were proposed.
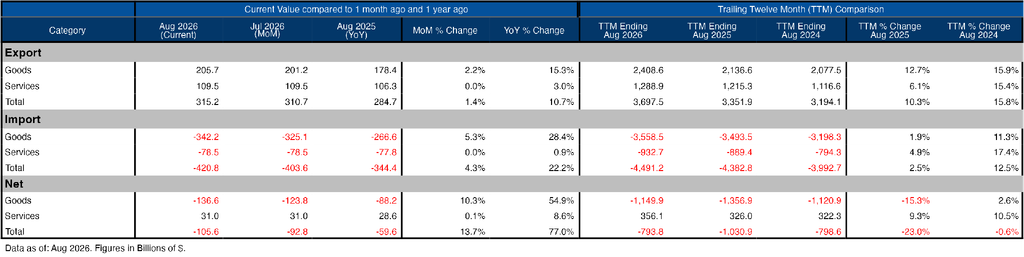
Figure: 2 Trade Balance Detail
Historical Perspective
Zooming out and focusing on the net numbers shows the longer-term trend. It really puts the current landscape into perspective. You can see the massive surge in the trade deficit from Jan to March last year as inventories were built up. It then rebounded back to pre-Covid levels before dropping again. It has now fallen off a cliff and is rapidly approaching the pre-tariff levels. Unfortunately, there is no clear macro theme driving this move. Instead, the deficit is just exploding rapidly with no clear-cut reason.
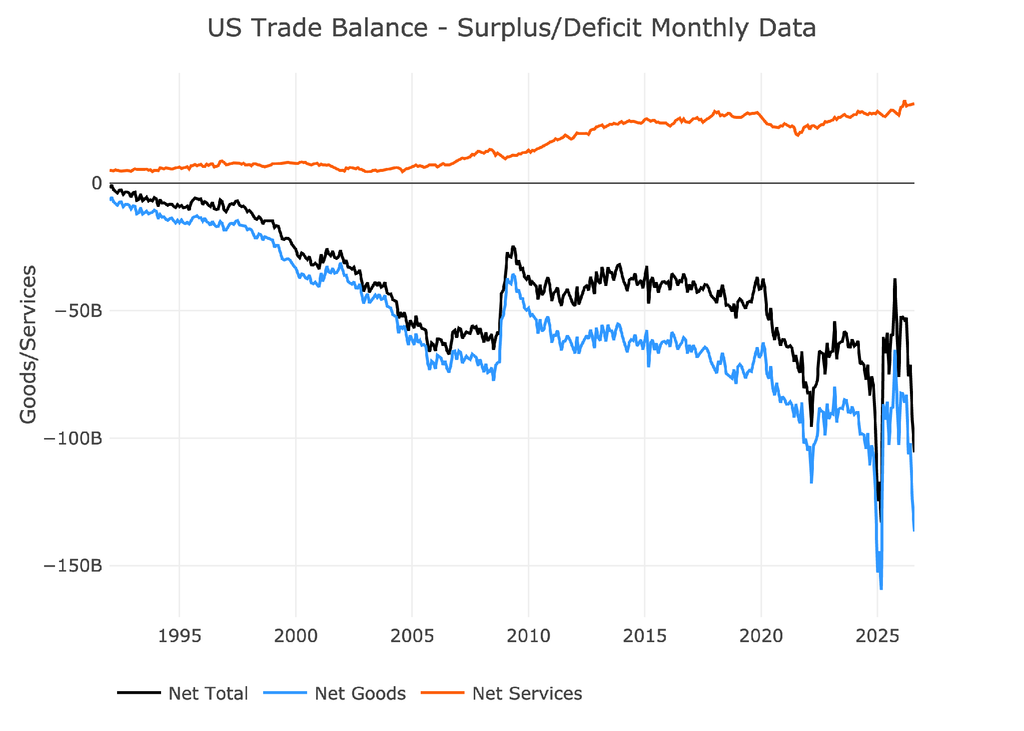
Figure: 3 Historical Net Trade Balance
The Services Surplus has been relatively unchanged for years now. It has been hanging out in the high 20% of total exported services.
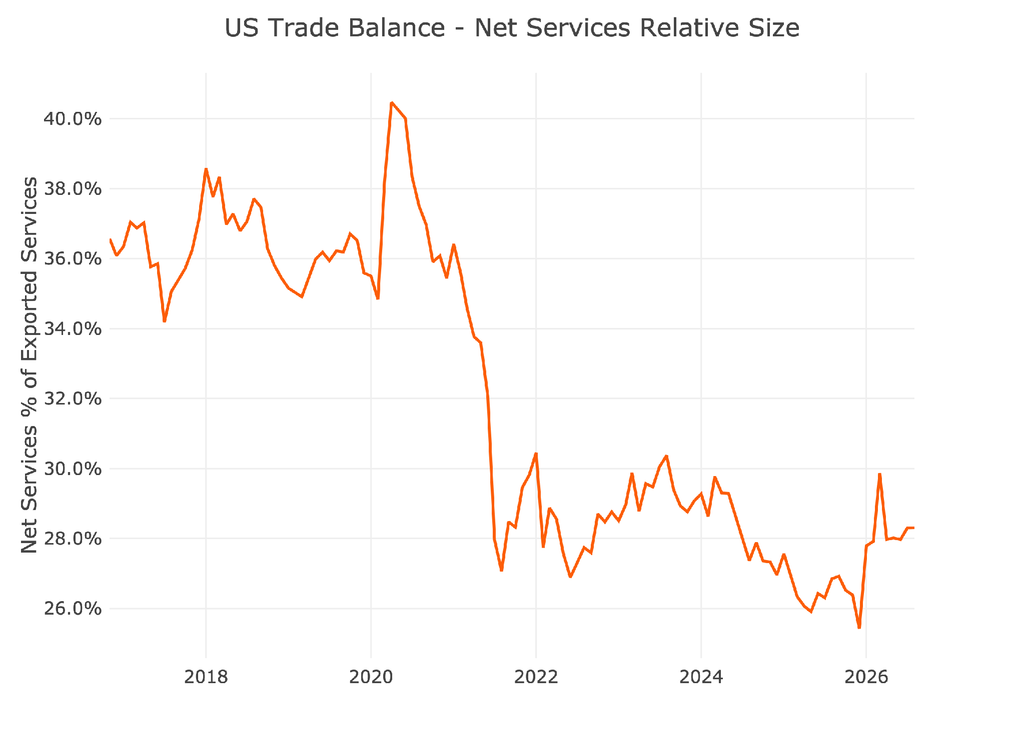
Figure: 4 Historical Services Surplus
To put it all together and remove some of the noise, the next plot below shows the Trailing Twelve Month (TTM) values for each month (i.e., each period represents the summation of the previous 12-months). You can really see how the recent period has taken off, with imports pulling away from exports. The surging goods imports are the concerning sign here, and we will need to watch to see if the trend continues.
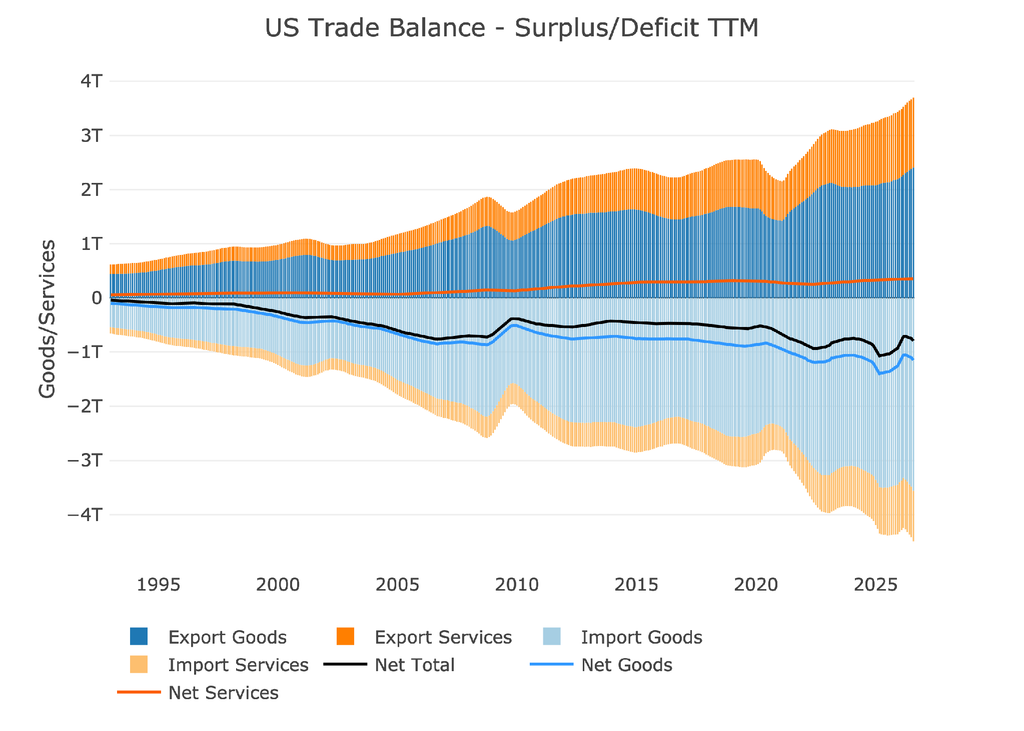
Figure: 5 Trailing 12 Months (TTM)
Despite the surge, it is actually not increasing as quickly as GDP. The TTM Net Trade Deficit as a percentage of GDP is only at 2.44%. This is relatively low compared to recent history.
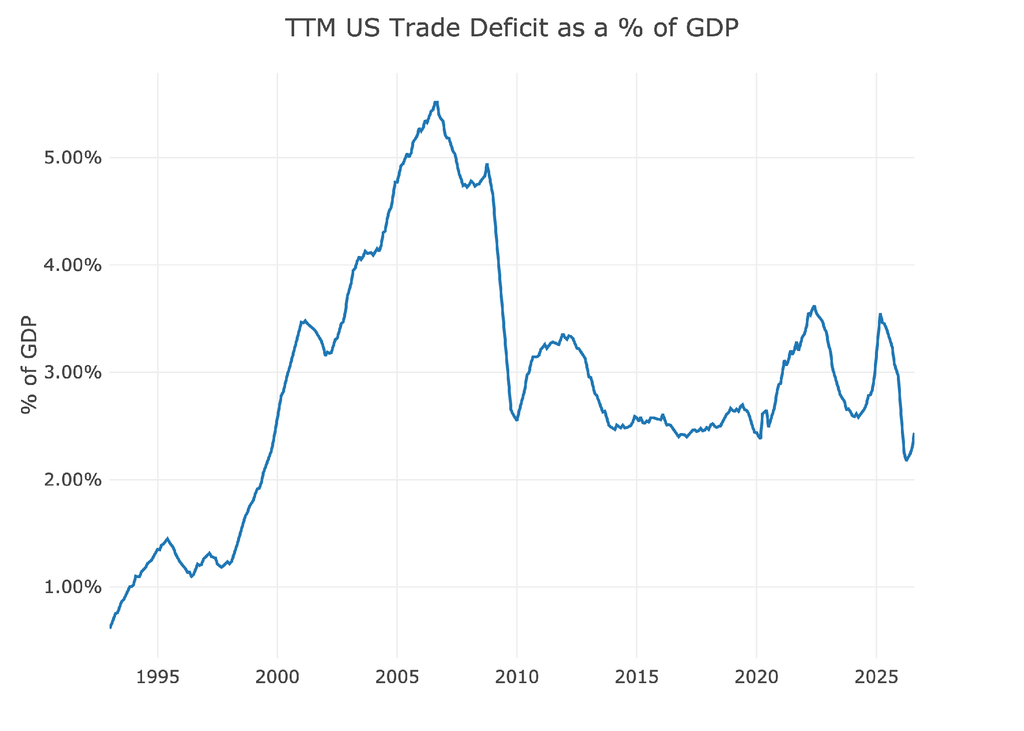
Figure: 6 TTM vs GDP
The chart below shows the YTD values. This is through August. You can see that the deficit was worse at the same point last year because of the inventory surge. It will be interesting to see if this holds as we approach the end of the calendar year.
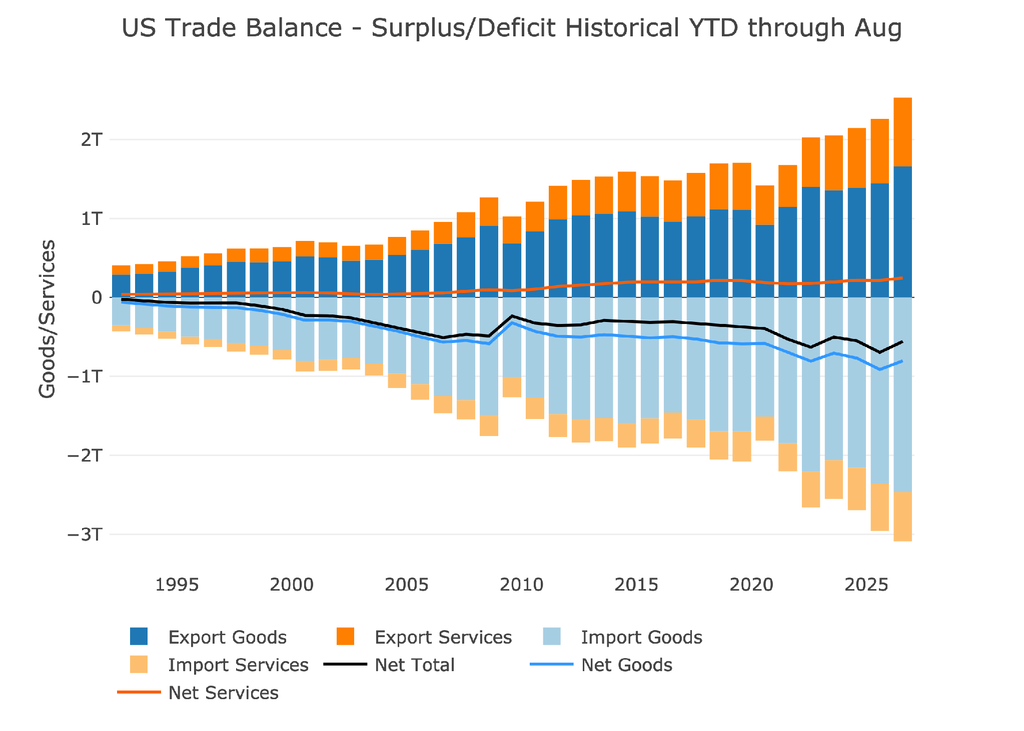
Figure: 7 Year to Date
Wrapping Up
The Trade Deficit still gets very little attention, but it serves as a huge windfall and potential risk for the US. For years, foreign countries were willing to provide goods and services in exchange for USD that far exceeds what they are buying with the USD they earn.
The Deficit is absolutely exploding right now, and there is no single clean explanation. The data points squarely at surging goods imports, but the reasons behind that surge are varied. A few possible drivers stand out: a boom in AI and data-center spending pulling in capital goods like semiconductors, computers, and chips; a notable jump in crude oil imports, including over 8 million additional barrels from Canada alone; large monthly gains in nonmonetary gold and other industrial supplies; and resilient domestic demand that kept businesses leaning on foreign-produced goods, offsetting the impact of aggressive tariffs. If this is a new trend, then the US might be in trouble. The data over the next few months will tell a complete story.

 Live Chat
 Email:
  Phone: 1-888-465-3160