
The Technicals: Getting Closer to a Bottom, but Not There Yet
Technical Analysis of Gold and Silver
This analysis attempts to look at different metrics to understand the current momentum in the gold and silver markets. It is meant as an analysis on potential price direction in the very short-term (a few weeks to 1-2 months).
In Q4, the technical analysis was strongly calling for a pullback or at least a consolidation period. The price indicators were quite bearish. The call may have been early by a few weeks but was an essential step if the bull market in both metals was going to continue.
In Q1, the analysis highlighted the break of support in gold and silver of $5000 and $80 as a short-term bearish indicator with more downside risk ahead. That turned out to be another accurate call.
In recent weeks, the market looked like it was starting to rebound after getting close to $4,000, climbing above $4,300. Then Warsh threw cold water on the rally with the most hawkish fed meeting in years. So beyond the fundamental picture, what is the data saying?
Let’s dive in…
Price Action
As highlighted last quarter, when gold and silver broke below $5000 and $80 convincingly, the next targets became $4500 and $70. With both of those now acting as resistance, we are knocking on the door of $4000 and $60. Prior to Warsh, these both seemed like solid support that had held multiple times. However, the market has turned quickly with both of these support levels in sight. If buying does not come in quick, then a break here has silver eyeing $50 and gold looking at about $3700. If those were to fall, then it would look like the bottom will be hit around $3300 and $40.
It seems unlikely $4000 and $60 are going to hold; however, if the metals get another reversal they would need to take out $4500 and $70 again to make the worst case highly less probable. Even with the worst case possibility we are closer to the bottom than the top. Still, that is a decent amount of downside potential (20% and 35%). Buying some a bit above the next two support levels ($3700/$50 and $3300/$40) should be pretty safe moves. However, in that scenario, new all-time highs may take up to 24 months to reach again in gold and probably longer in silver.
Outlook: Bearish
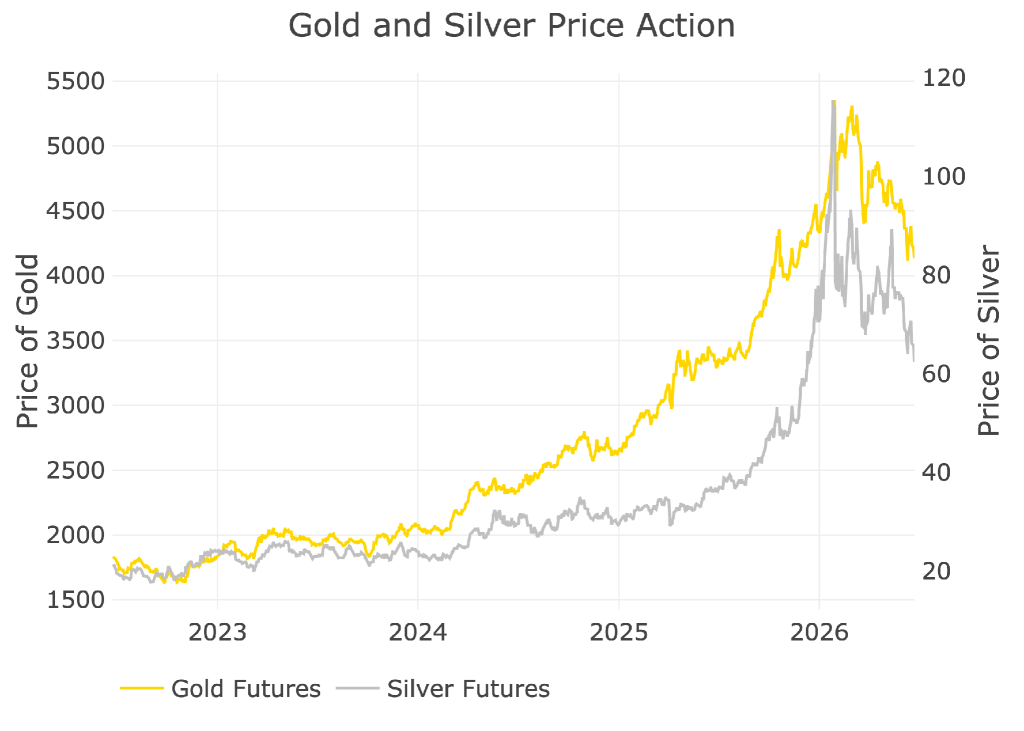
Figure: 1 Gold and Silver Price Action
The log chart is now looking like a mirror image of both 2008 and 2011. Based on the length of this bull market and the explosive moves over previous resistance, 2008 still seems like the more probable path (a sooner rally to new highs vs a multi-year downturn).
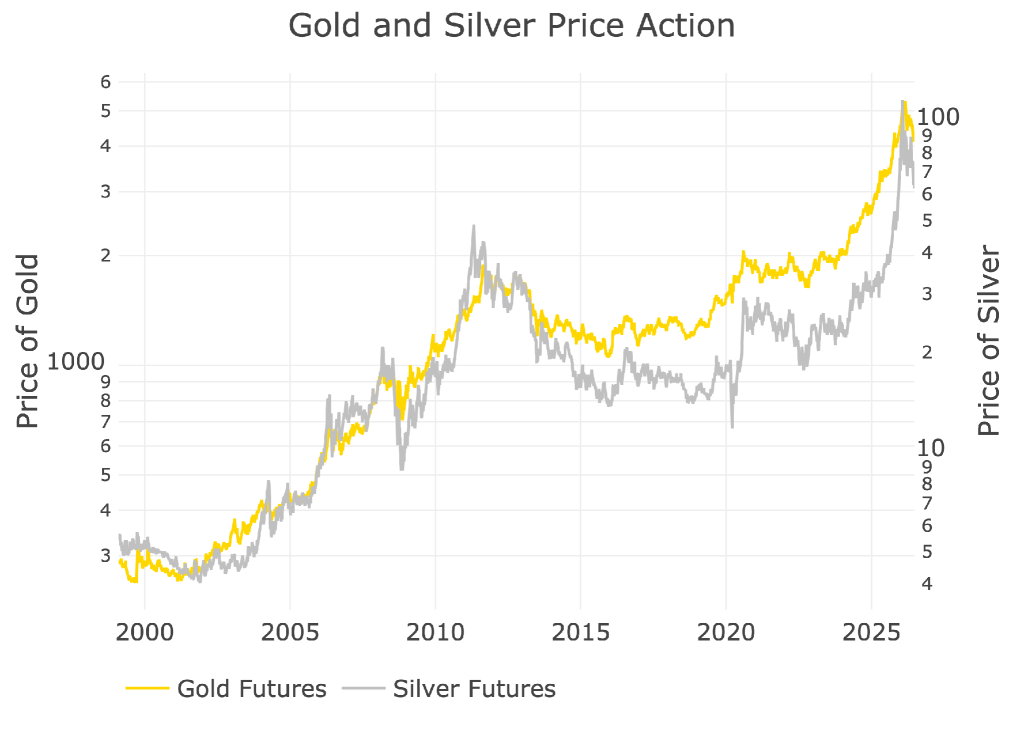
Figure: 2 Gold and Silver Price Action
Daily Moving Averages (DMA)
Gold
The price of gold is now comfortably below the 200 DMA of $4,460. The 50 DMA is still above it so a death cross has not yet formed, but it seems inevitable. The good news is that over the last 10 years, every death cross has brought a quick move down but then quickly finds firm support. While it hasn’t always triggered an immediate reversal, it usually means the bottom is very close with limited downside remaining.
This makes sense as it’s when the last group of traders throw in the towel and exit. Once the sellers are exhausted, gold will have little downside left and then it becomes a question of when it is able to mount the comeback. But buying at those levels is generally very safe.
Again, while painful, this is the type of market clearing gold needs to start the next up move in this bull market.
Outlook: Bearish
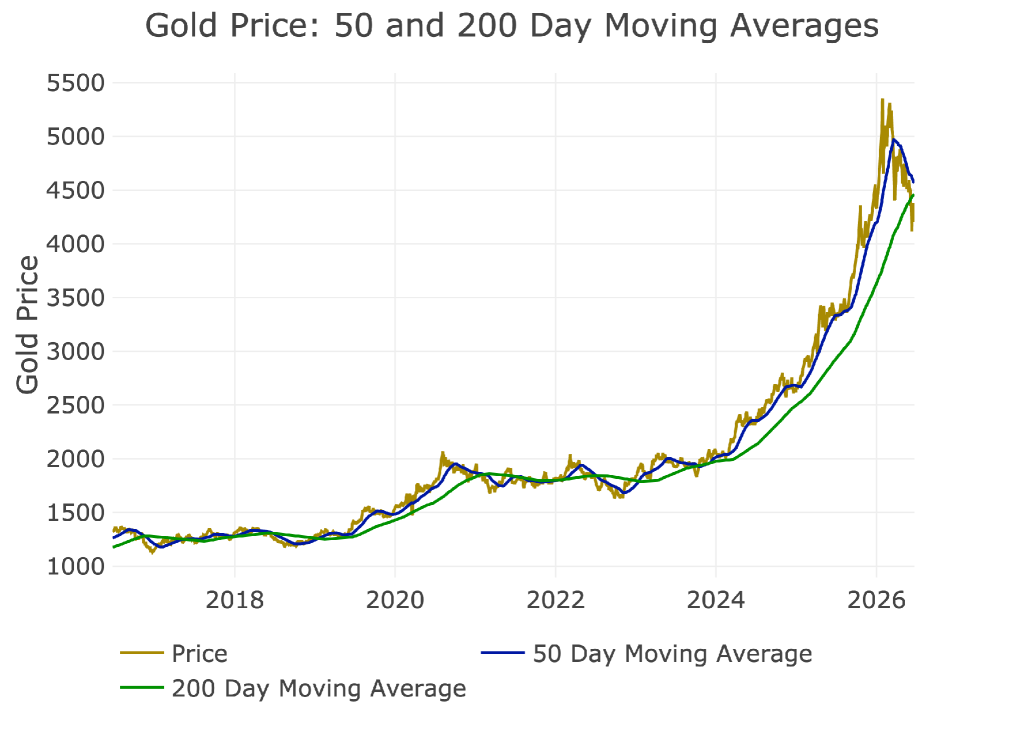
Figure: 3 Gold 50/200 DMA
Silver
Silver is below both DMAs but has a bigger gap before a death cross forms. This is why there is bigger downside potential in silver than in gold as it tries to close this gap. Still though, similar to gold, a death cross usually means a bottom is close. Unfortunately, we are still far away from that death cross which is why silver has more room to fall.
Outlook: Bearish
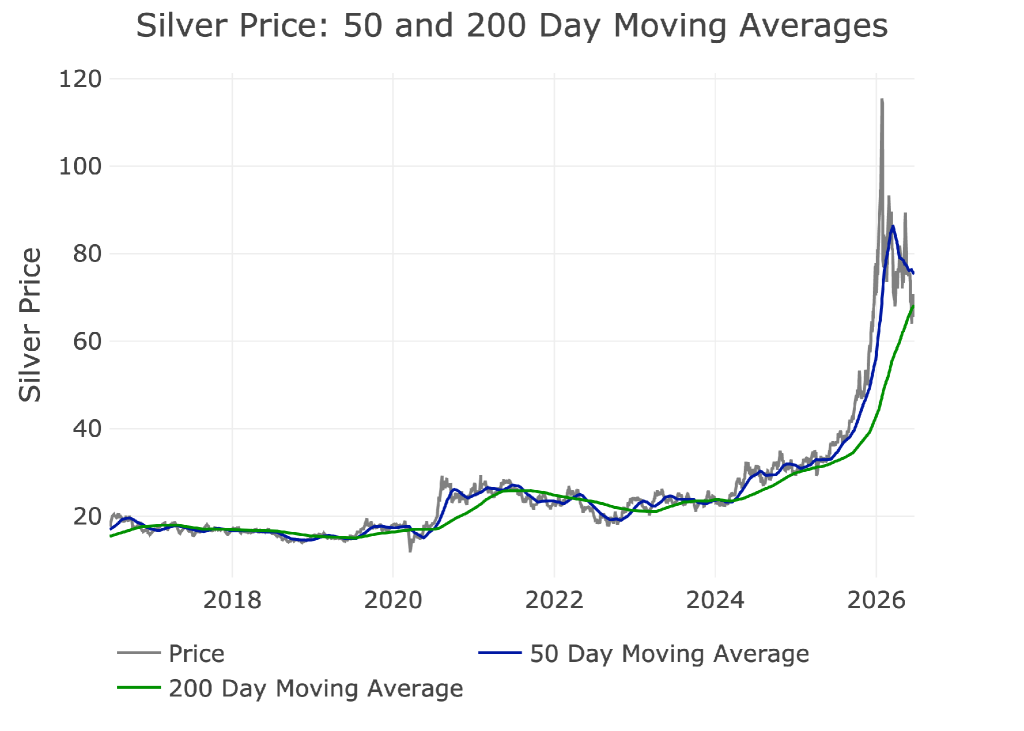
Figure: 4 Silver 50/200 DMA
Comex Open Interest
Gold
Open interest continues to hit multi-year lows for both metals. This means most of the speculative traders have already left the market. While downside potential is certainly there, this chart alone shows that we are closer to the bottom of this pullback than the top.
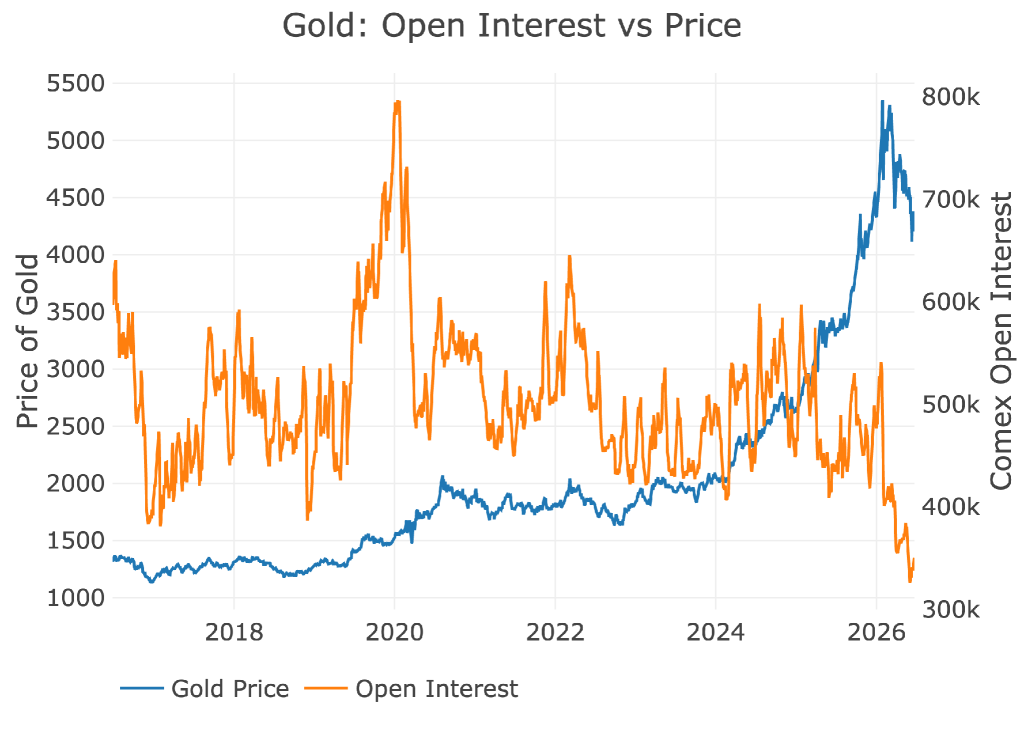
Figure: 5 Gold Price vs Open Interest
On a notional level (factoring in price), the number does not look as stark but could find support in this current range because it’s the same level as most of last year.
Outlook: Neutral to Bullish
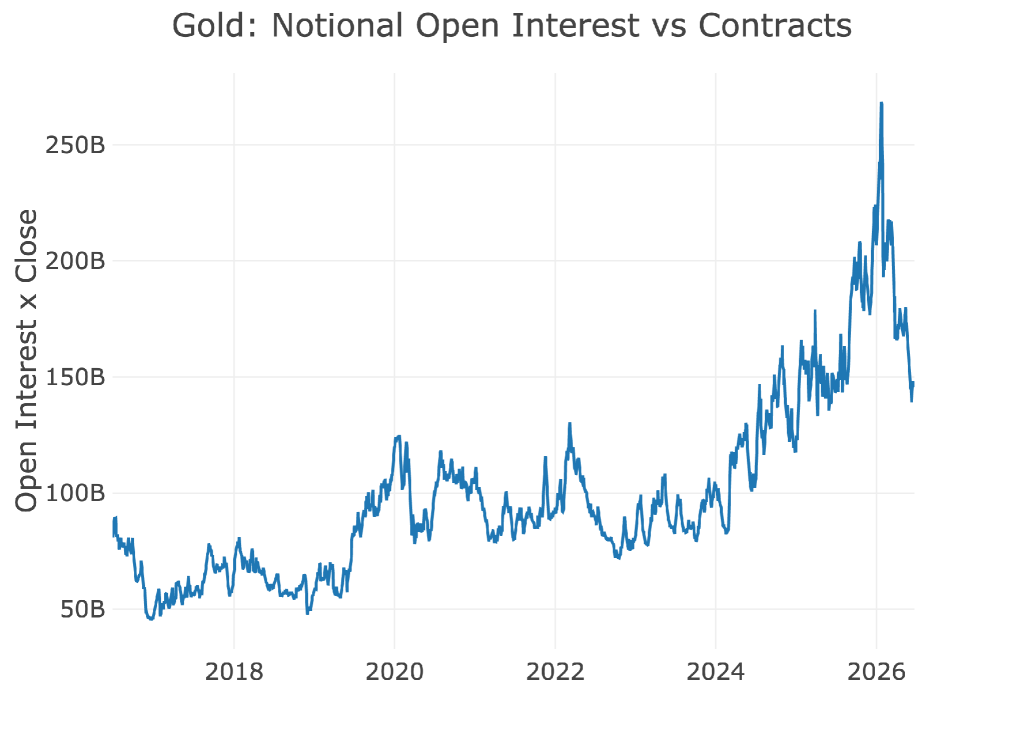
Figure: 6 Gold Notional Open Interest
Silver
Silver open interest has taken a massive dive, even bigger than gold. This is another good sign of speculative flush outs.
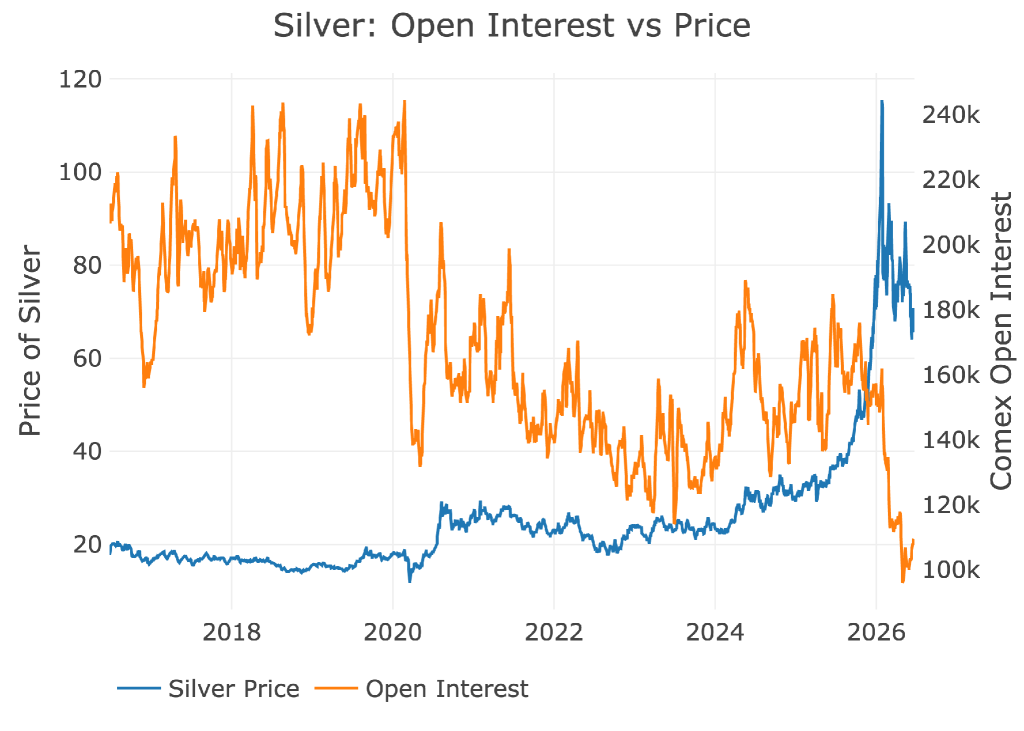
Figure: 7 Silver Price vs Open Interest
Similar to gold, silver saw an explosive move in notional exposure despite a collapse in open interest. It’s now more than double the $20B it sat at for years, but is well below the explosive recent top at $93B.
Outlook: Neutral to Bullish
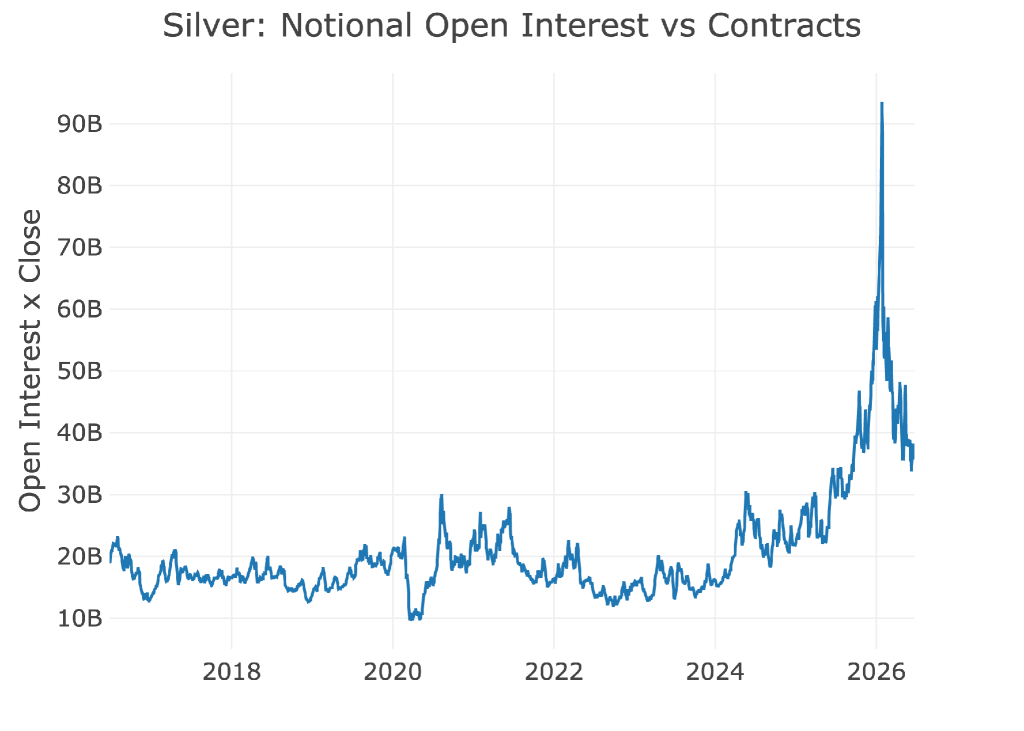
Figure: 8 Silver Notional Open Interest
ETF Shares Outstanding
GLD and SLV are the two most popular ETFs that track Gold and Silver. While institutions will buy these funds, this data generally shows retail interest. The chart shows the price and shares outstanding. Shares outstanding is the metric that shows overall retail interest.
Gold
Retail never got fully on board, like they did in 2011 and 2020. There has been a slight dip in shares outstanding to bring the number back to shares outstanding from September 2025. This is right before the market went vertical. You definitely have more downside here down to about 300M shares, but the immediate hot money that came in after September has now all left. Unfortunately, the signal here says that despair is not high enough.
It would have been better to see shares outstanding dip further with the recent sell-offs. This now indicates retail is still too bullish to be at a bottom. This next wave of selling down to $3300 in the worst case could come from retail throwing in the towel via GLD.
Outlook: Bearish
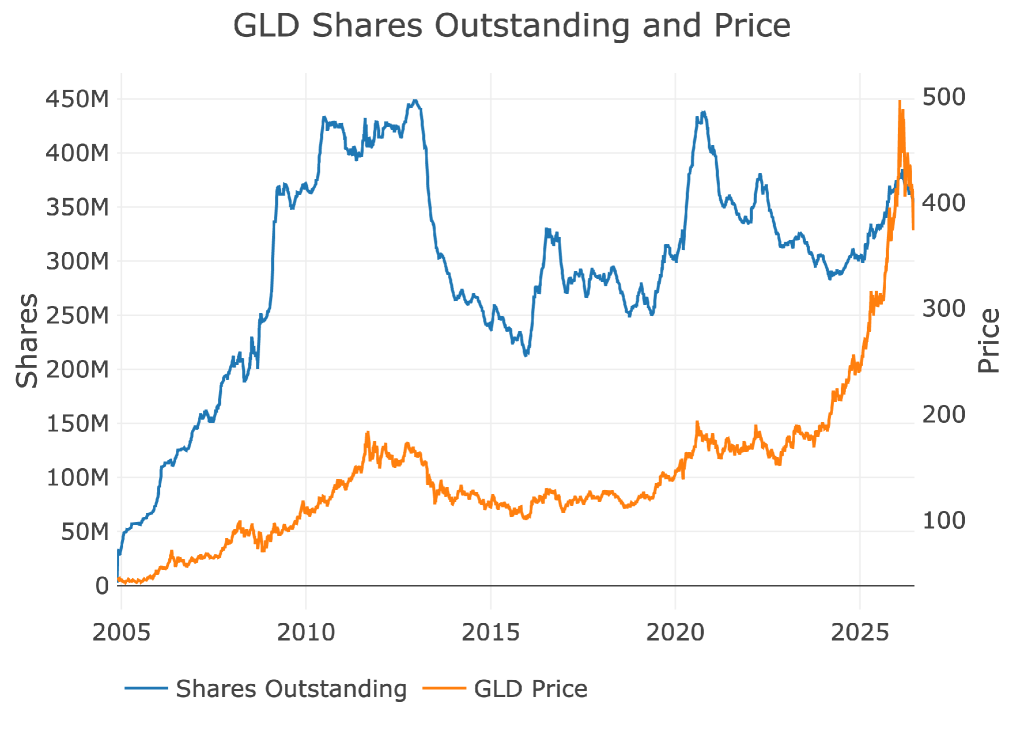
Figure: 9 ETF Analysis
Silver
SLV is in a very similar boat. Steady accumulation over the last year, with very mild liquidations over the last few months to get rid of the most hot money. This was never a retail frenzy, but it still shows that the slow buyers over the last two years have not been chased out yet. Even with the hot money leaving, sentiment is not negative enough here to indicate a bottom is definitely in.
Outlook: Bearish
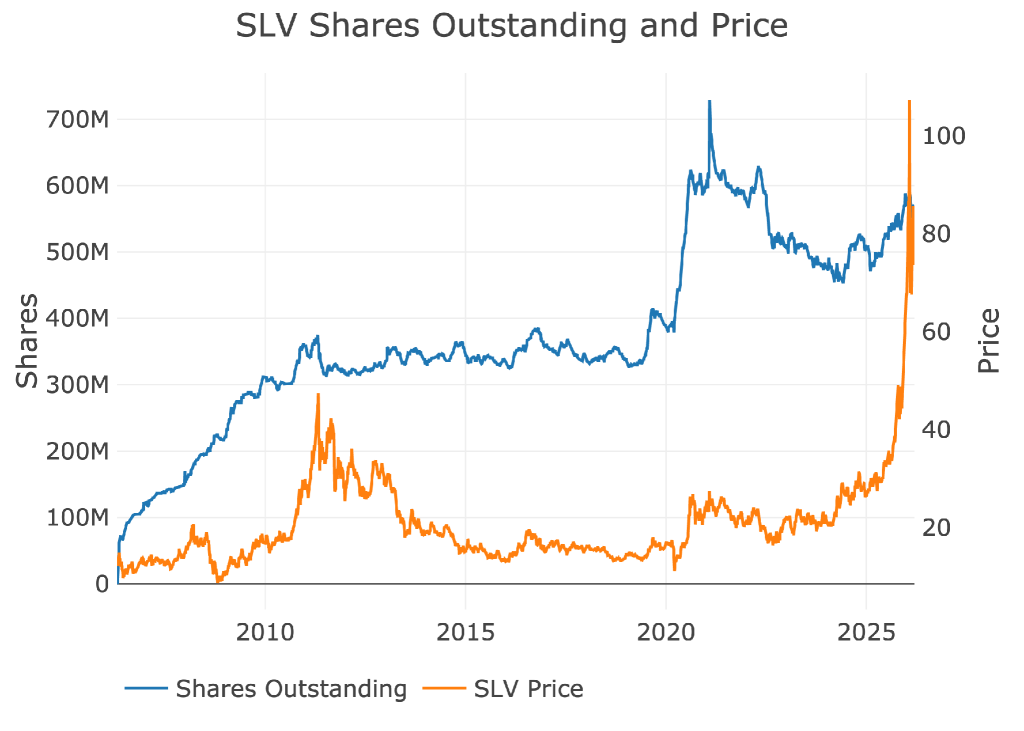
Figure: 10 ETF Analysis
Margin Rates and Open Interest
The CME uses margin requirements to pull momentum out of the futures market. This is usually done to halt explosive up moves and contain them, but can be used in quick bear markets as both shorts and long are subject to margin requirements. A few months ago, the CME changed their margin requirements from fixed dollar amounts to a percentage basis. This would allow the market to be self adjusting during big moves.
The change in margin definitely had the desired effect to flush out the hot money.
Gold
Margin rates sky rocketed to their highest level on record in the recent price run as the CME tried to damper the run. This was possibly the single biggest reason open interest collapsed. It is more expensive to get exposure. With margin now dropping over the last several months the CME has been able to reload it’s ammunition to suppress any big price moves. Meaning if gold prices start to run and gain momentum, the CME can push back with higher margin.
While more buyers can enter at lower margin, big runs will be met with higher margin requirements, slowing any big moves.
Outlook: Neutral
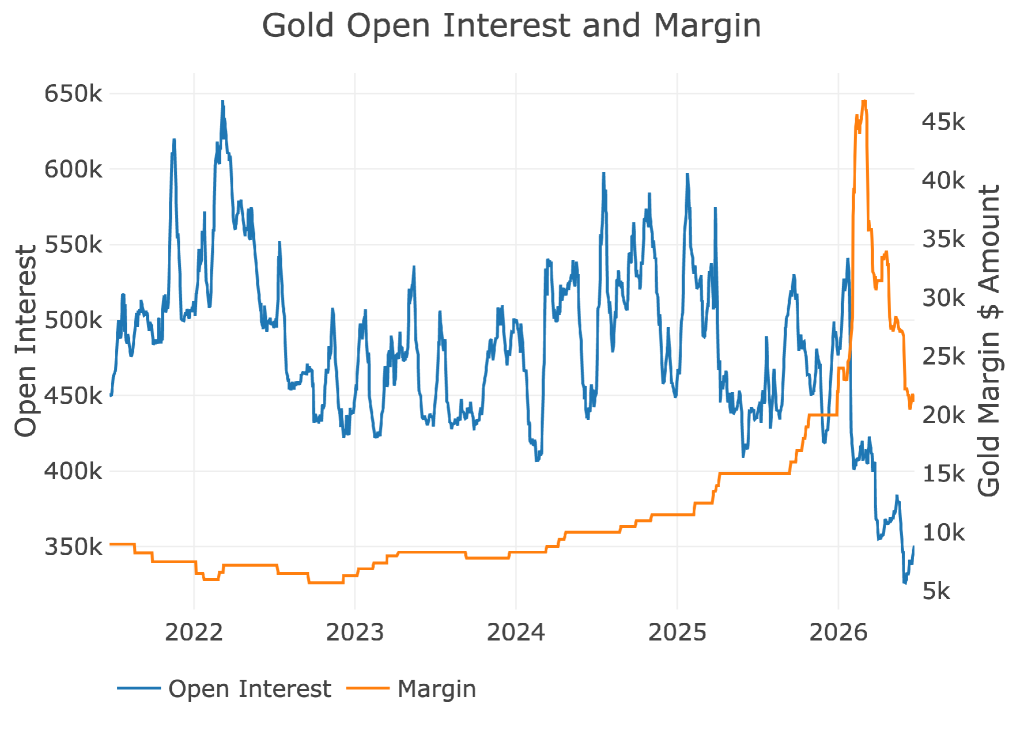
Figure: 11 Gold Margin Dollar Rate
Silver
Almost the exact same thing has played out in silver. A massive spike in margin led to a significant drop in open interest. While it chased out hot money giving more room for buyers to enter again, the recent drop in margin allows the CME to halt any momentum moves by re-raising margin.
Outlook: Bullish
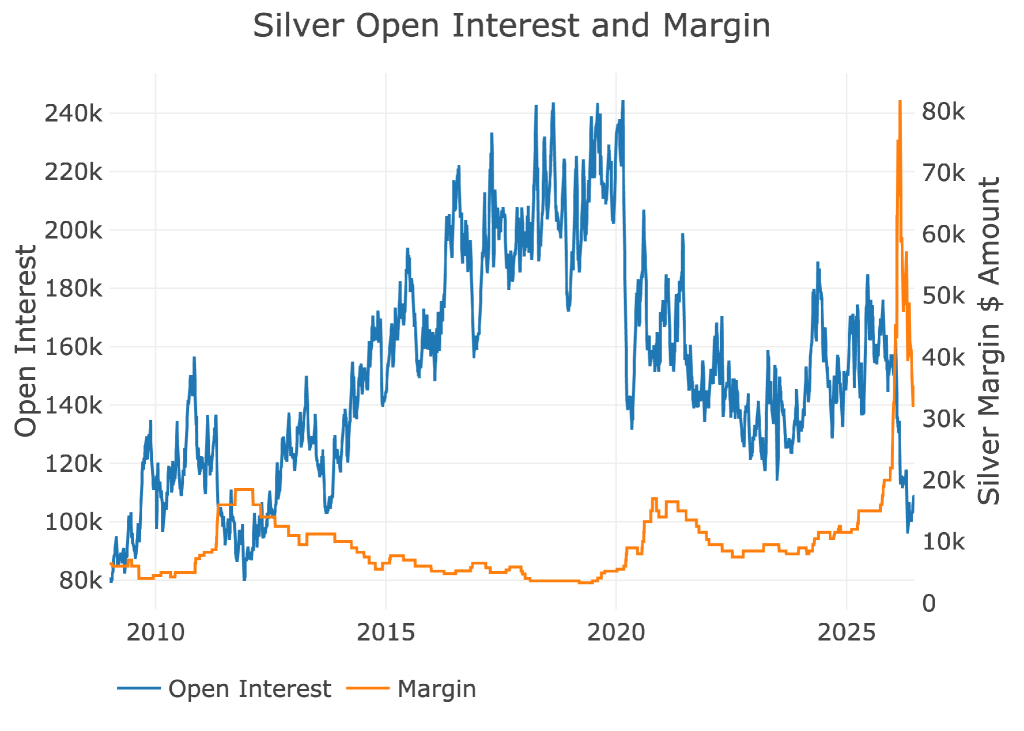
Figure: 12 Silver Margin Dollar Rate
Gold Miners
The miners represent the long-term investors in the gold market. When GLD falls 3% and miners drop 8%, and when GLD climbs 3% and miners climb 2%… it tells you that the equity investors are terrified that the gold price is unsustainable. GLD has been dragging GDX along with it for years, with GDX mostly lagging.
In August, GDX finally started to catch-up and actually make gains on GLD. But it has given up almost all of those gains. The miners have led the moves in the underlying metal. In January, the miners were showing weakness at the end of the month, even while the metals were making new ATHs. Just last week, the miners were leading the metal up, showing that momentum might be returning. And then Warsh gave his speech and the miners resumed their descent. According to this chart, it looks like the equity investors are still not totally scared yet that gold is going to break support. However, if the GDX takes out the recent low at $74 this would be a pretty solid signal that gold is going to fall through $4,000.
The next move in the miners will foreshadow the next move in the metals. This has been a consistent theme.
Outlook: Neutral
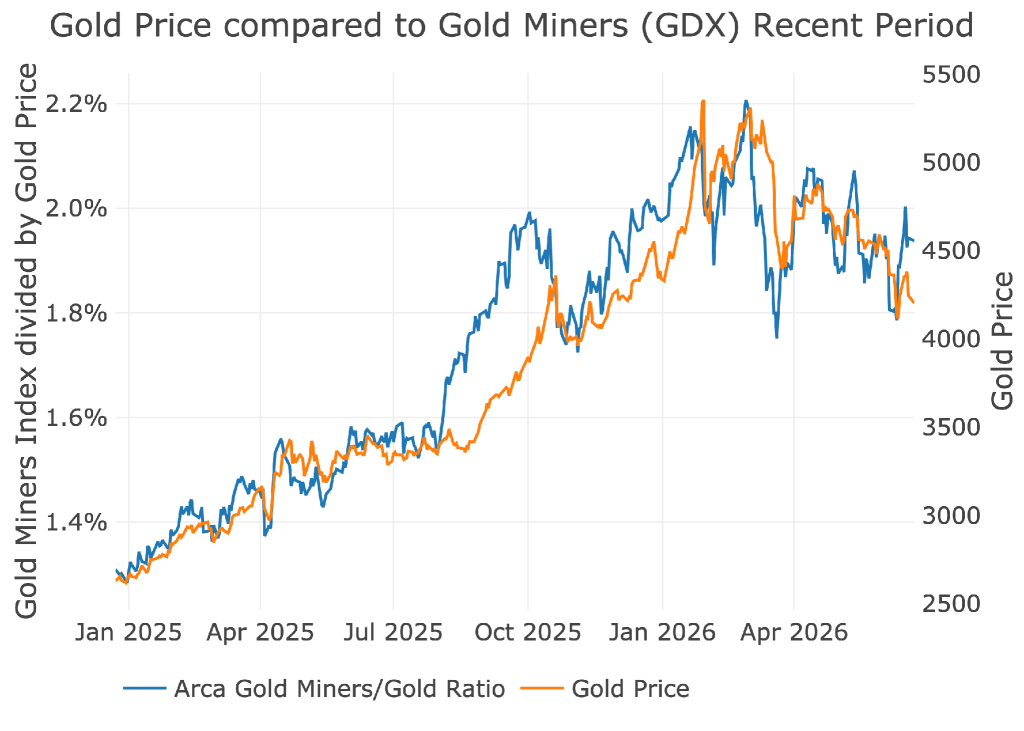
Figure: 13 Arca Gold Miners to Gold Current Trend
While the micro level does have the miners leading the metals, the long term chart shows that investors have fallen way out of love with the miners. The miners still have room to triple from here even if gold just holds where it is.
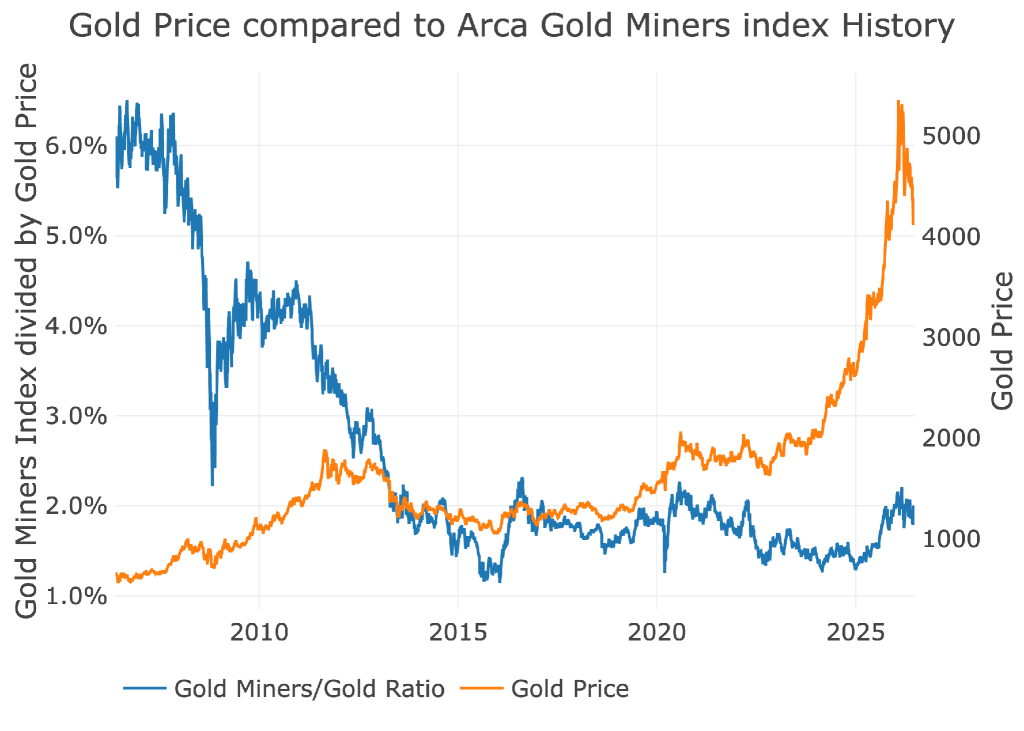
Figure: 14 Arca Gold Miners to Gold Historical Trend
Trade Volume
The next indicator is trade volume on the CME. This is related to, but not exactly tied to open interest. Higher trade volume with flat open interest can mean churn. Higher trade volume can also be met with increases or decreases in open interest if buyers or sellers are in control.
In gold, trade volume has dropped but not as dramatically as open interest. If the volume were falling more dramatically, it would show that sentiment was negative and interest was truly gone. While there has been a ton of wash out, the last leg or two down are still there to fully destroy sentiment.
Outlook: Neutral
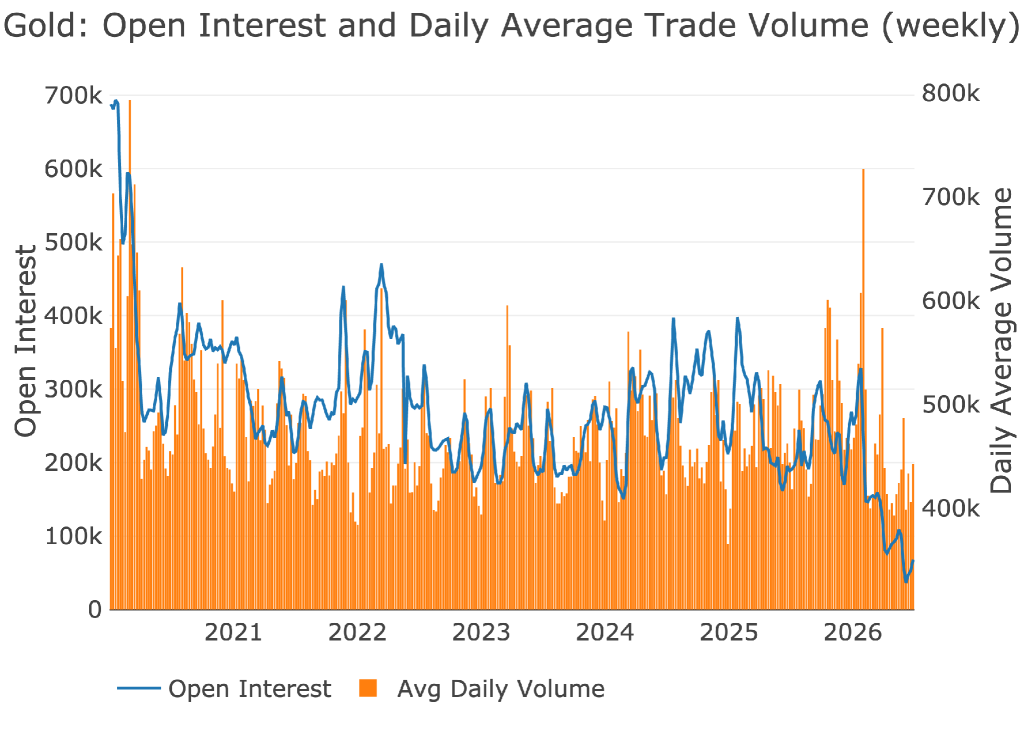
Figure: 15 Gold Volume and Open Interest
Silver trade volume has plummeted. Again, this is usually a good sign, but given the dramatic fall in open interest, trade volume should have been expected to fall even more.
Outlook: Neutral
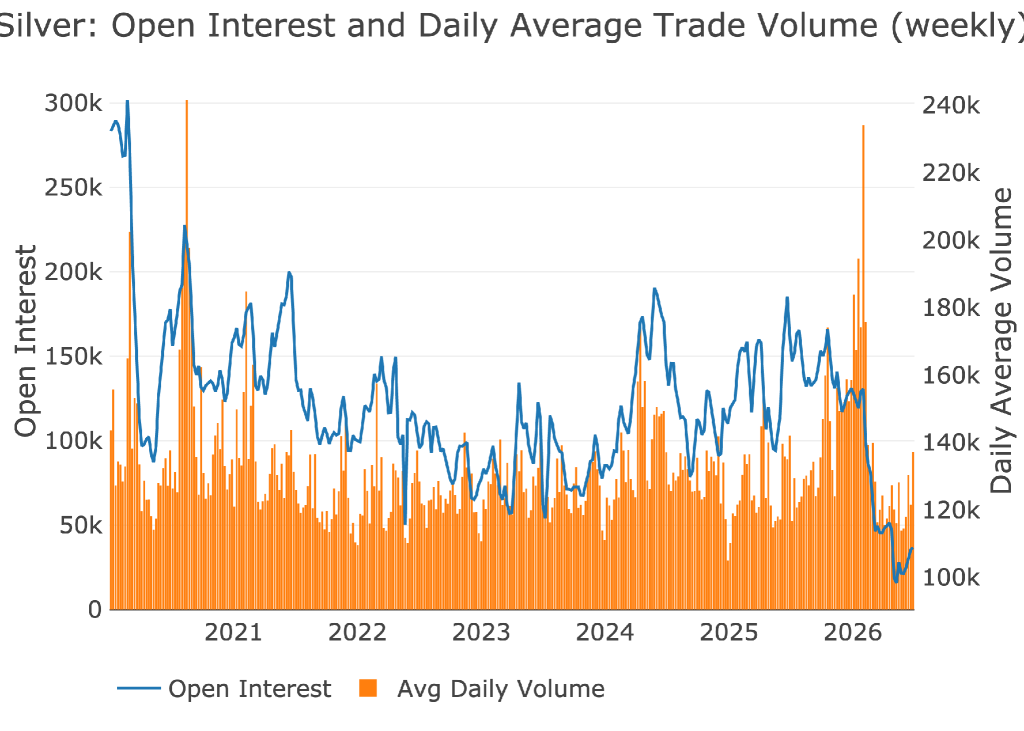
Figure: 16 Silver Volume and Open Interest
Other drivers
USD
Price action can be driven by activity in the US Dollar exchange rate. A big move up in gold will often occur simultaneously with a move down in the US dollar. The dollar is still hovering near 100 which is on the higher side over the last 20 years. The war in Iran has created a small rally in the Dollar, but less so than history would indicate.
Gold and silver have definitely been hit by the stronger dollar in recent weeks. That said, the lack of the DXY to really spike with the war in Iran indicates the world is moving away from the Dollar. This means gold will become the new global currency of the world as central banks continue to buy.
Outlook: Bullish
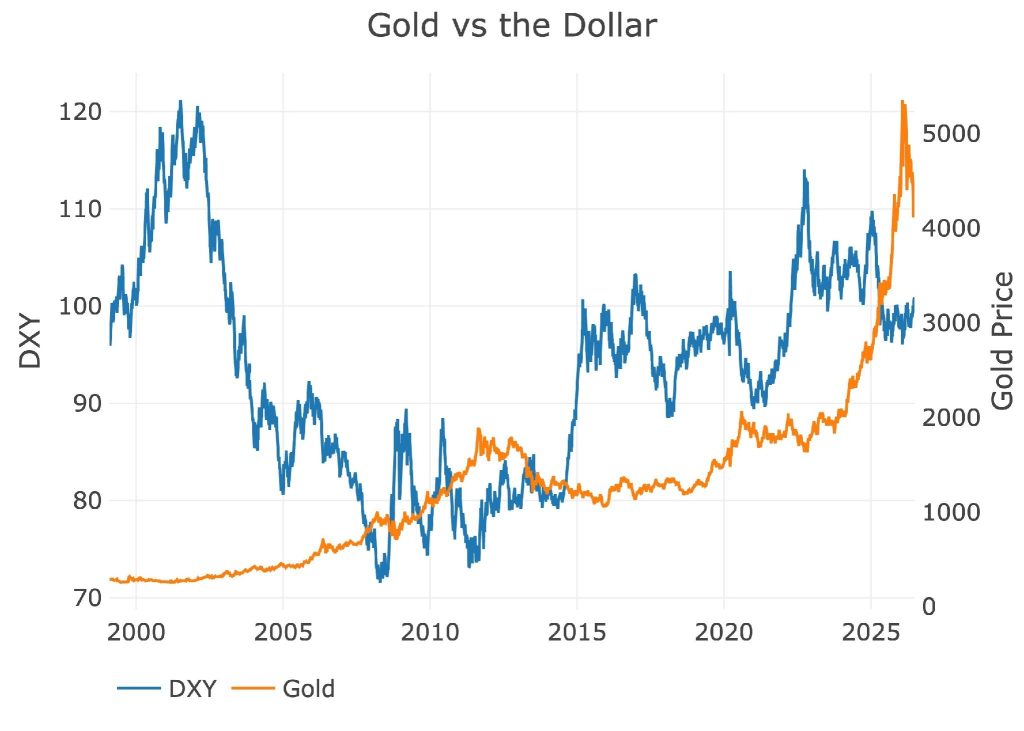
Figure: 17 Price Compare DXY and GLD
Gold Silver Ratio
The gold silver ratio collapsed as silver spiked. It went too far too fast. It is come back up some, but once again has not fully washed out sentiment. The gold silver ratio should be naturally lower than it has been the last 10 years, but it should get there more gradually than it did. It would be good to see this current area hold and for silver to build support against gold.
Outlook: Neutral
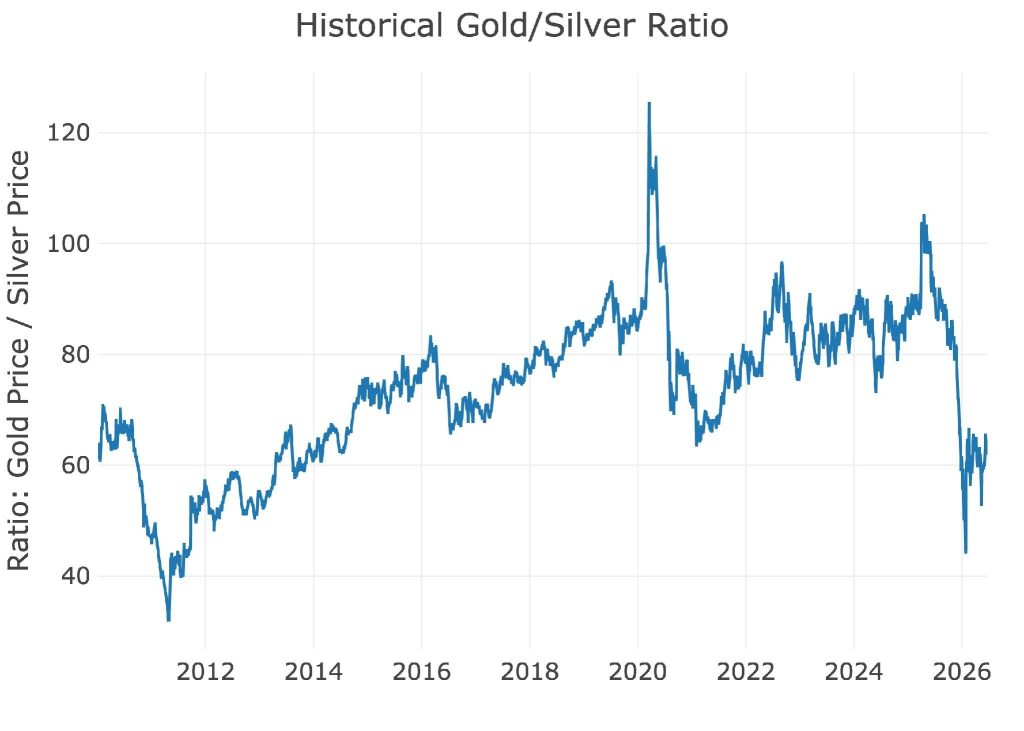
Figure: 18 Gold Silver Ratio
Gold Volatility Index
The GVZ is like the VIX for gold. It shows how the options traders are pricing the gold market. Right now, the indicator is coming back down after a massive spike. It would be good to see the implied volatility continue to fall.
Outlook: Neutral
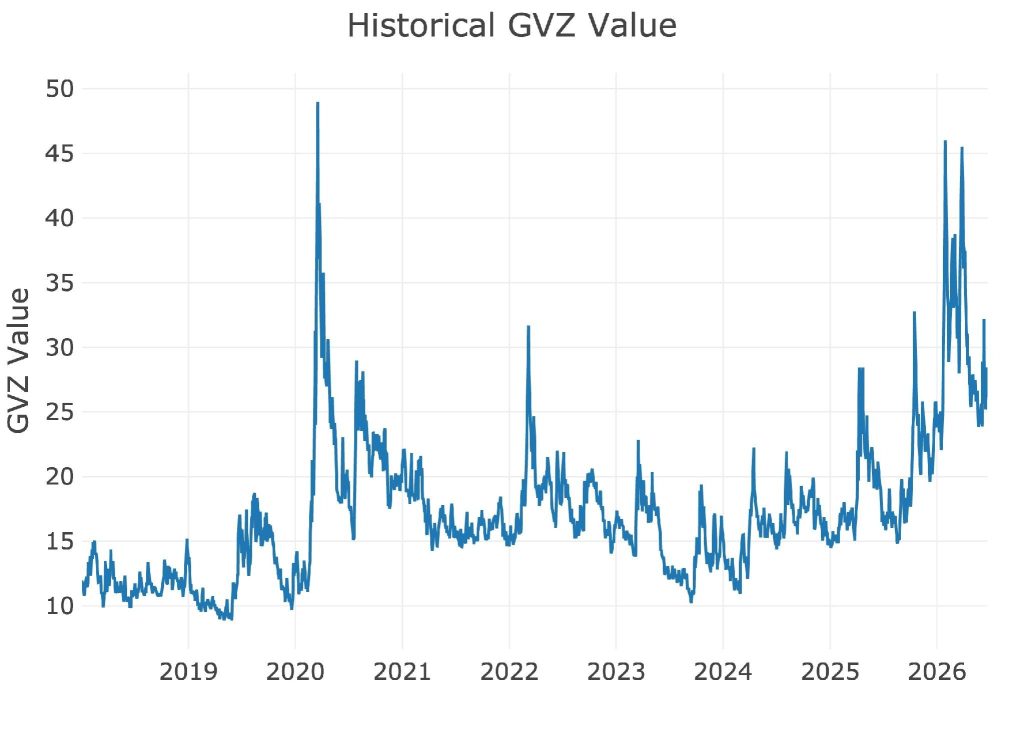
Figure: 19 Gold Volatility Index (GVZ)
Conclusion
Back when the market was ripping, a lot of the indicators looked bullish. At this time the conclusion was that the only thing making the bullish case less likely is everything looks bullish. But the market continued to rally from there for a bit longer. The picture is now revered. Everything looks bearish or neutral. This likely means more downside is ahead, but the bottom is near.
Buying now won’t hurt you over the long-term, but there is likely a much more aggressive buying opportunity coming once gold breaks $4000 and then the market is hit with one more final washout to get out the last of the weak handed investors.
