
The Technicals: The Next Move Looks Bullish but it Needs to Come Sooner Rather than Later
Technical Analysis of Gold and Silver
This analysis attempts to look at different metrics to understand the current momentum in the gold and silver markets. It is meant as an analysis on potential price direction in the very short-term (a few weeks to 1-2 months).
In Q1, the analysis highlighted the break of support in gold and silver of $5000 and $80 as a short-term bearish indicator with more downside risk ahead. That turned out to be another accurate call.
In Q2, the analysis conducted around $4150 mentioned we were nearing the bottom but still had room to move lower. While the full bearish case was not hit, gold did continue lower before a sharp turnaround in August.
After rebounding strongly off $4000 gold met resistance around $4600 and has since pulled back to consolidate further in the $4200- $4400 range. With the Fed turning more hawkish lately, precious metals lost some shine. So where is the data pointing next? Let’s dive in…
Price Action
Gold and silver are still digesting the massive move seen in 2025 and January of 2026. While the pullback has been steep, it is not uncharacteristic given the massive move and the froth seen in the market. Both metals are consolidating comfortably above support around $4000 in gold and $55 in silver. However, both metals are also far from resistance which stand around $4650-$4800 and $72-$78.
This leaves the price action in a very neutral stance as both metals have plenty of room between both sides of key levels. A decisive break of either level on the upside or downside will trigger strong follow through. Until those key levels are hit, the price action is in a holding pattern.
Outlook: Neutral
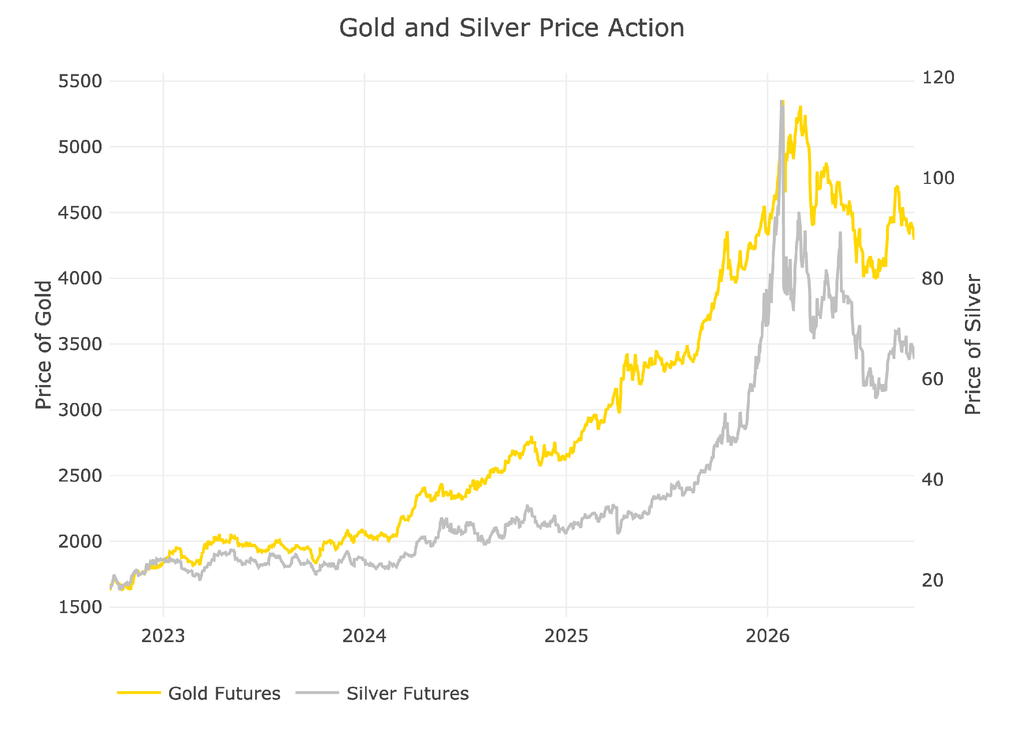
Figure: 1 Gold and Silver Price Action
The log chart is now looking like a mirror image of both 2008 and 2011. Based on the length of this bull market and the explosive moves over previous resistance, 2008 still seems like the more probable path (a sooner rally to new highs vs a multi-year downturn). However, a catalyst is needed soon to get moving higher or else metals could drift lower and potentially enter the 2011 type scenario. The metals need to challenge new highs again soon or $4000 and $55 come back into play as the key levels that will get broken.
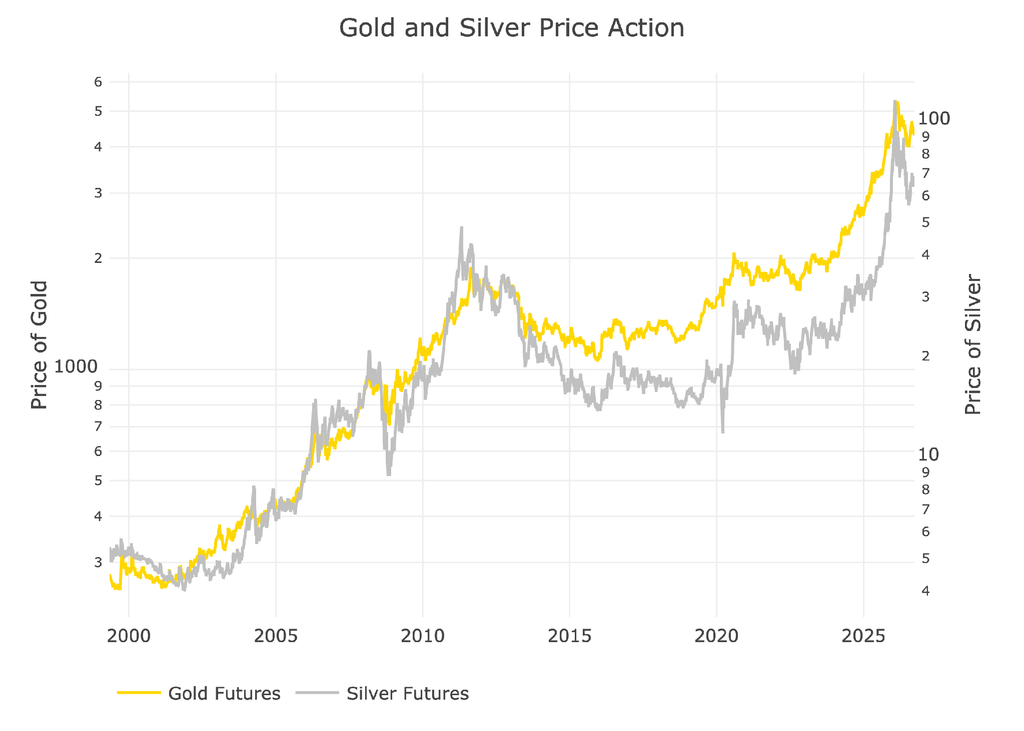
Figure: 2 Gold and Silver Price Action
Daily Moving Averages (DMA)
Gold
The bad news is that the 50 DMA and the current price sit below the 200 DMA of $4557. The good news is that both moving averages are sloping upwards. This is usually a bullish signal. Similar to the analysis on the log chart above, the price needs to start moving up soon or both curves will start sloping down. That becomes bearish. Time is working against the metals if they stay in this holding pattern too long. But until the lines slope down, the outlook tilts bullish.
Outlook: Bullish
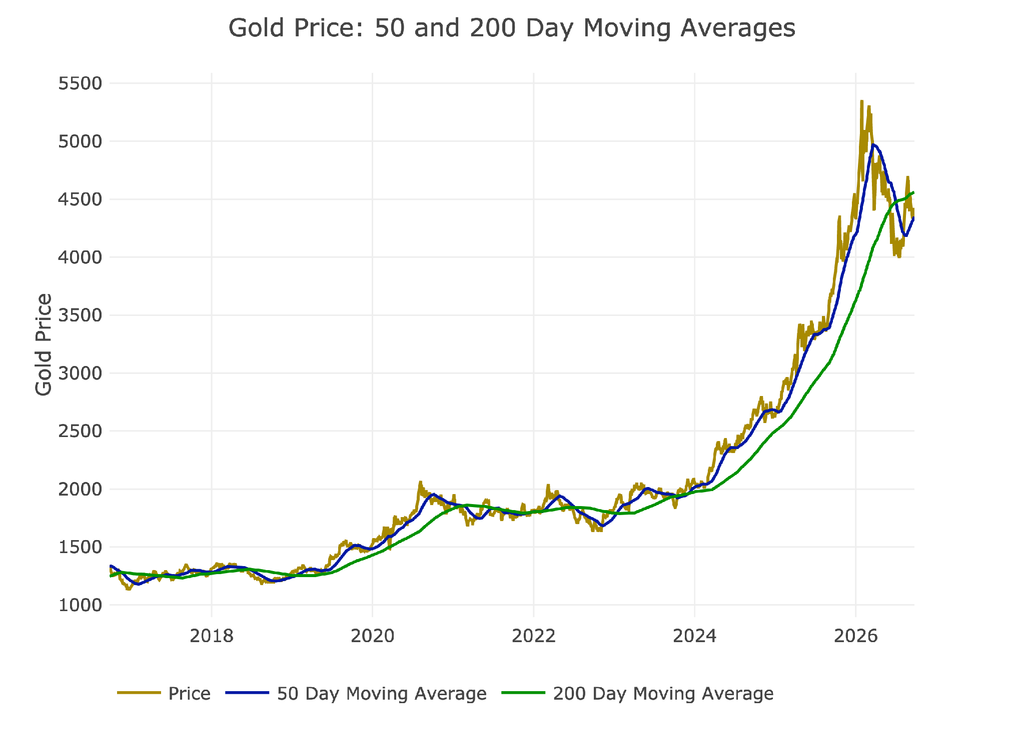
Figure: 3 Gold 50/200 DMA
Silver
Silver is the same as gold here. Both metals’ current prices are right at their 50 DMA. If that breaks it could open the door lower, but if it bounces here that would be bullish. Again, the tilt is bullish as long as both DMAs are sloping up.
Outlook: Bullish
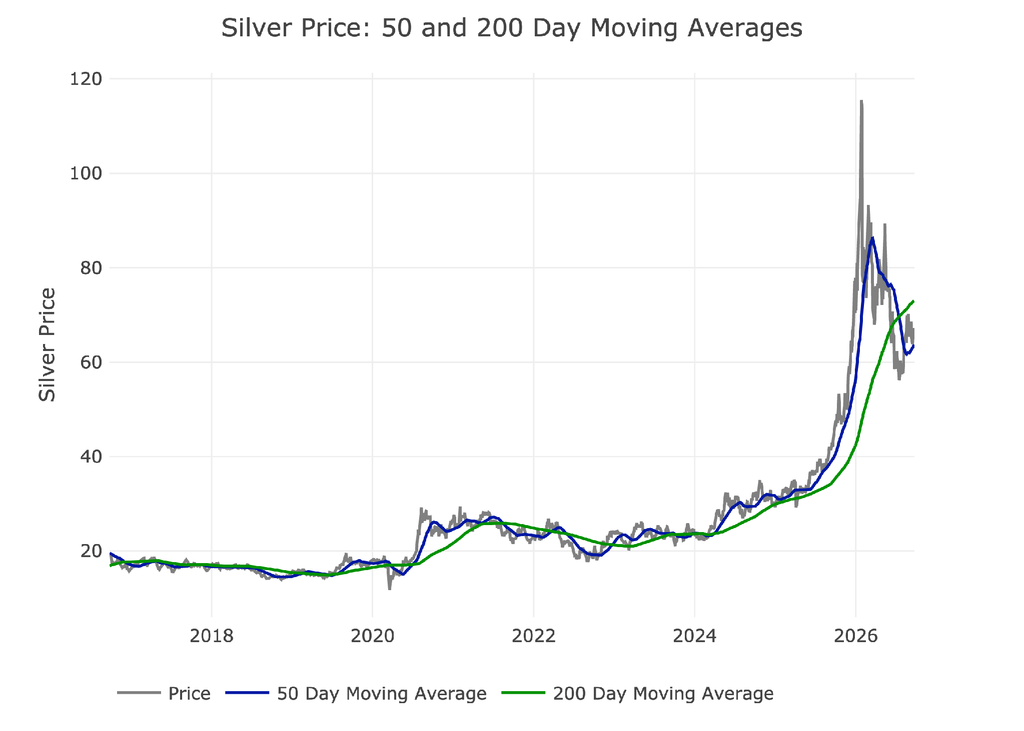
Figure: 4 Silver 50/200 DMA
Comex Open Interest
Gold
Open interest did see a pop after hitting a low in June, but open interest is still well below historical averages. Some of this has to do with Asian markets starting to attract more activity as a market built around physical delivery. Still, speculators will trade on the Comex. The chart below shows that some speculation came back in after capitulation, but most speculative money is sitting on the sidelines.
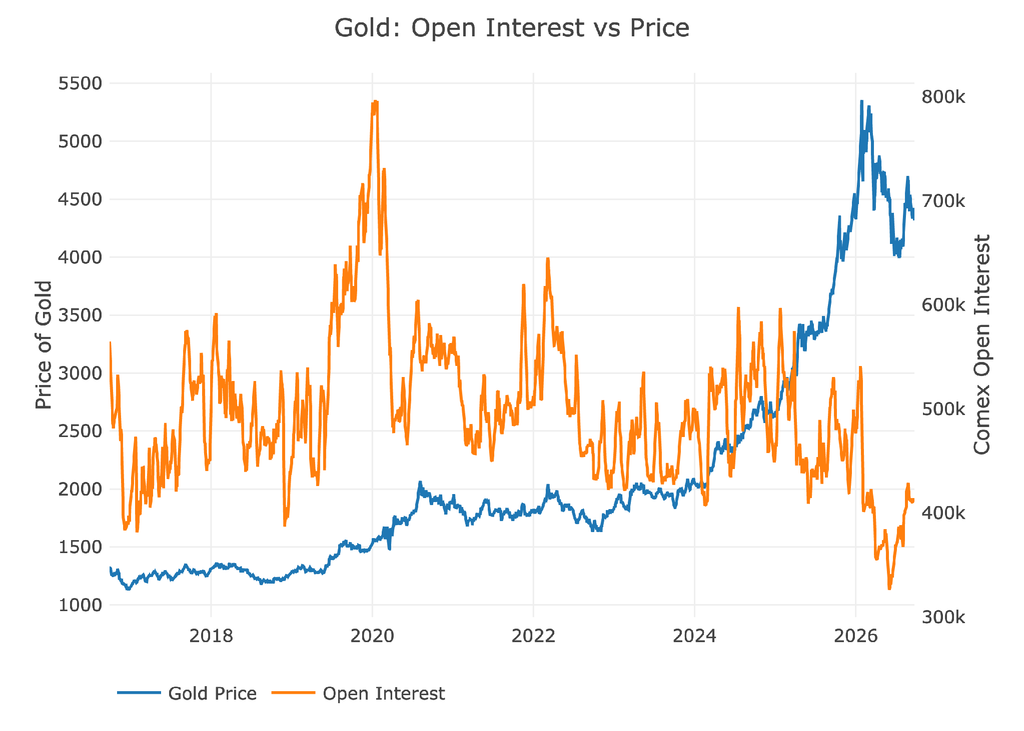
Figure: 5 Gold Price vs Open Interest
Silver
Silver open interest is even more dire than gold. This is actually a good sign. There is almost no speculative money sitting in silver right now. That means there is much less room for selling pressure to materialize and the market is more likely to get hit with an influx of buying that could rocket prices higher.
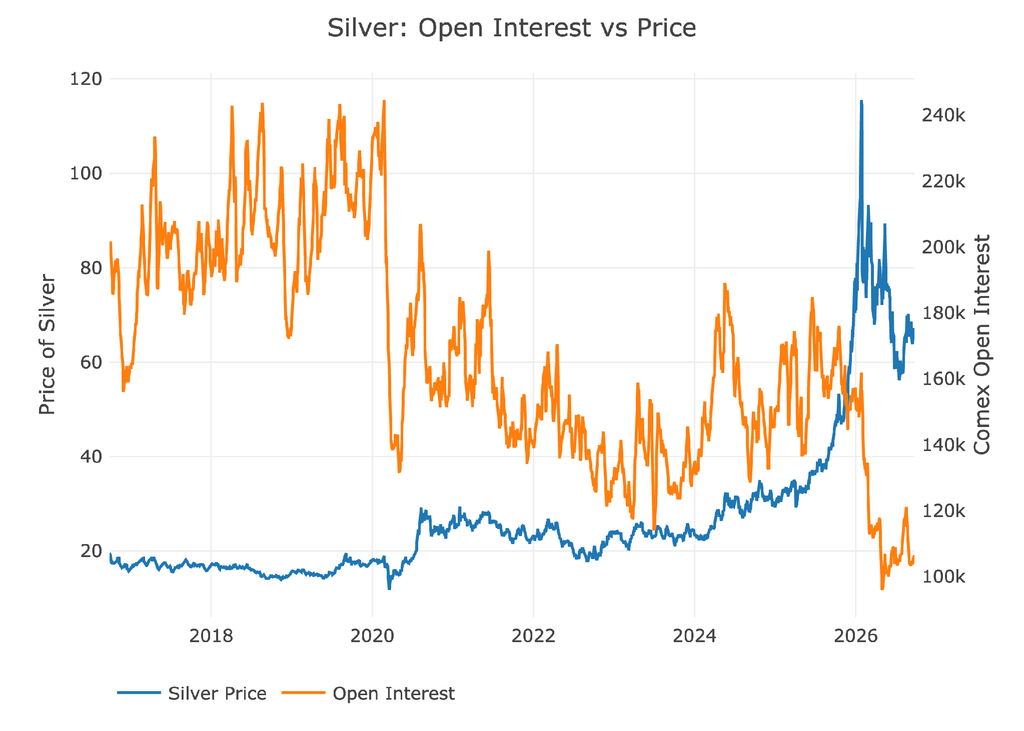
Figure: 7 Silver Price vs Open Interest
Bottom line is that there has been an incredible wash out of speculative money. This leaves less opportunity for selling to materialize. There just aren’t many holders to sell. This leaves much more room to the upside than downside.
Outlook: Bullish
ETF Shares Outstanding
GLD and SLV are the two most popular ETFs that track Gold and Silver. While institutions will buy these funds, this data generally shows retail interest. The chart shows the price and shares outstanding. Shares outstanding is the metric that shows overall retail interest.
Gold
Retail never got fully on board, like they did in 2011 and 2020. There has been a slight dip and minor recovery. But this chart tells you that the market never actually got as frothy as it did at other periods. The current level is exactly between recent highs and recent lows. This is less bullish than the open interest charts and suggests a more neutral posture. You have potential buyers and sellers on both sides right now.
Outlook: Neutral
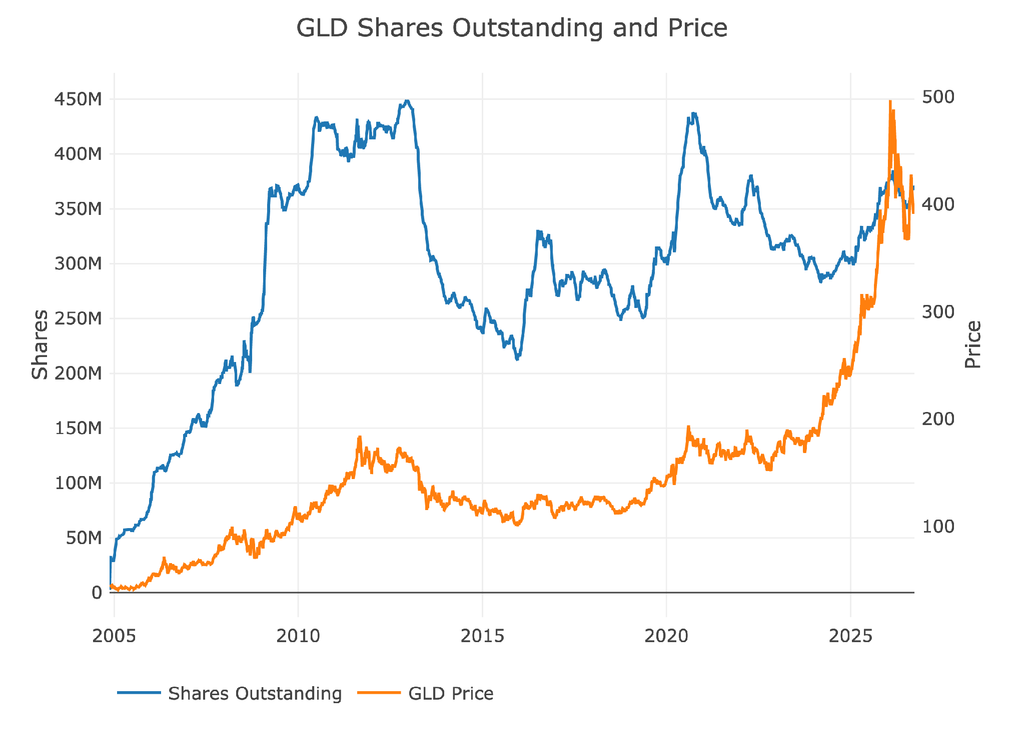
Figure: 9 ETF Analysis
Silver
SLV is in a very similar boat. It never got as frothy as 2020. Saw a pullback earlier this year and then a slight recovery. It sits in the middle of the top and the bottom.
Outlook: Neutral
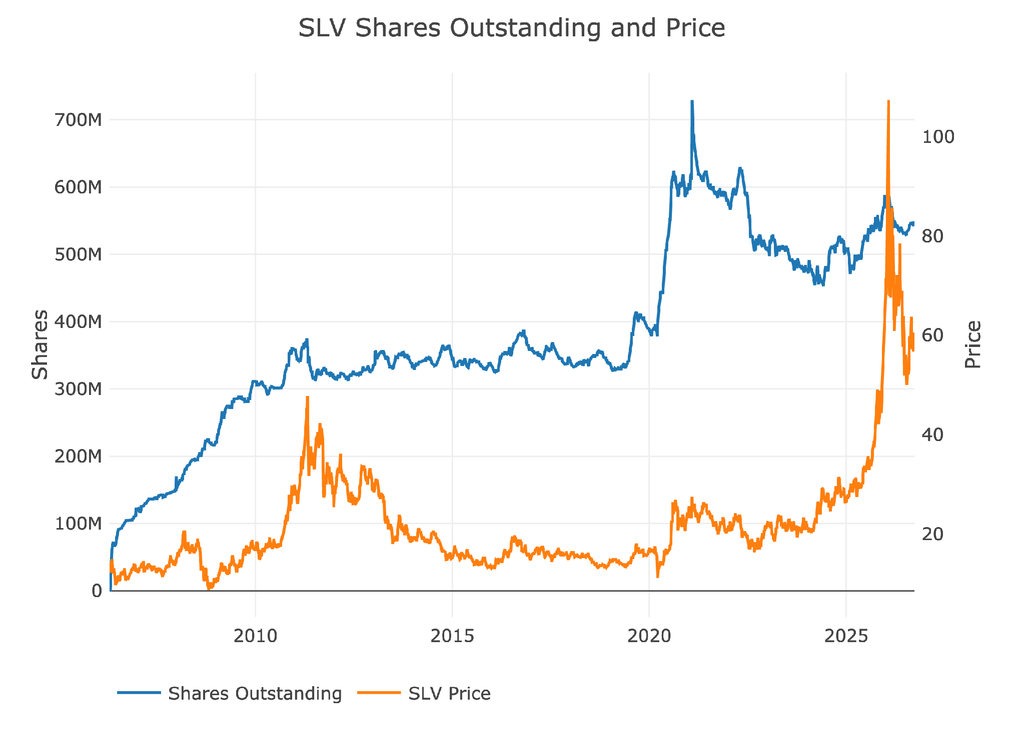
Figure: 10 ETF Analysis
Margin Rates and Open Interest
The CME uses margin requirements to pull momentum out of the futures market. This is usually done to halt explosive up moves and contain them, but can be used in quick bear markets as both shorts and long are subject to margin requirements. A few months ago, the CME changed their margin requirements from fixed dollar amounts to a percentage basis. This would allow the market to be self adjusting during big moves.
The change in margin definitely had the desired effect to flush out the hot money.
Gold
Margin rates sky rocketed to their highest level on record in January-March as the CME tried to damper the run. This was possibly the single biggest reason open interest collapsed. It is more expensive to get exposure. With margin now dropping over the last several months the CME has been able to reload it’s ammunition to suppress any big price moves. Meaning if gold prices start to run and gain momentum, the CME can push back with higher margin.
While more buyers can enter at lower margin, big runs will be met with higher margin requirements, slowing any big moves.
Outlook: Bearish
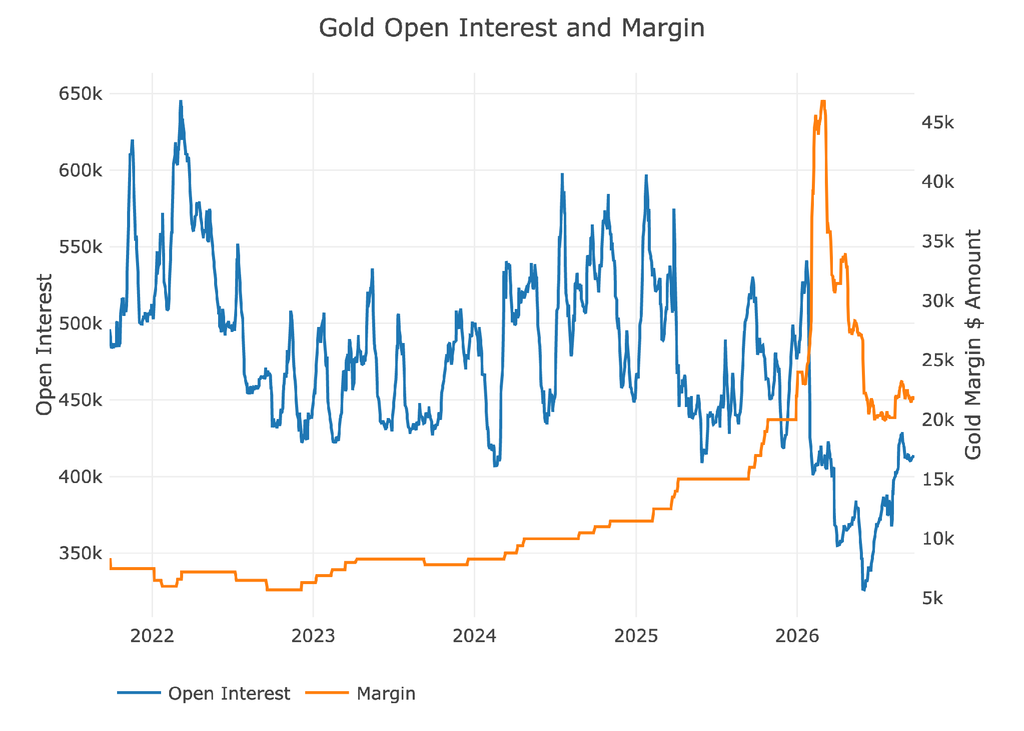
Figure: 11 Gold Margin Dollar Rate
Silver
Almost the exact same thing has played out in silver. A massive spike in margin led to a significant drop in open interest. While it chased out hot money giving more room for buyers to enter again, the recent drop in margin allows the CME to halt any momentum moves by re-raising margin.
Outlook: Bullish
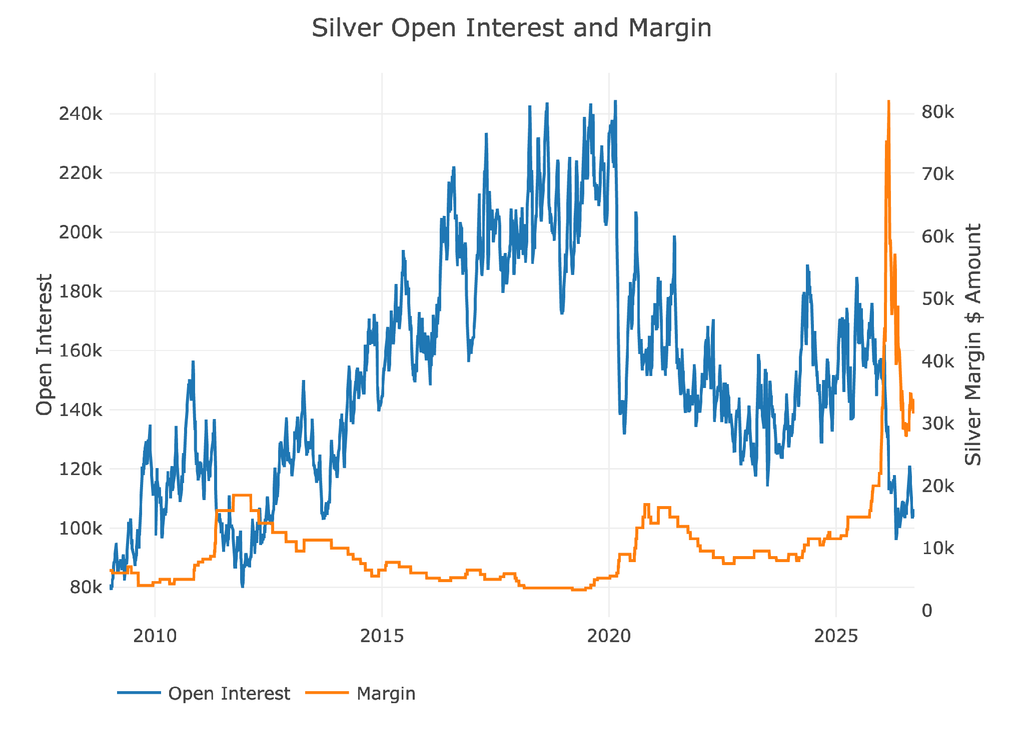
Figure: 12 Silver Margin Dollar Rate
Gold Miners
The miners represent the long-term investors in the gold market. When GLD falls 3% and miners drop 8%, and when GLD climbs 3% and miners climb 2%… it tells you that the equity investors are terrified that the gold price is unsustainable. GLD has been dragging GDX along with it for years, with GDX mostly lagging.
In August 2025, GDX finally started to catch-up and actually make gains on GLD. But it gave up most of those gains and dropped back to about 1.8% in July. That said, the miners definitely led gold on the recent move higher that kicked off in earnest this past August. While gold has fallen back down, the miners have held up remarkably well.
Last quarter I wrote The next move in the miners will foreshadow the next move in the metals. The miners certainly did that with the recent move. The fact they have been holding up is actually an incredibly bullish sign.
Outlook: Bullish
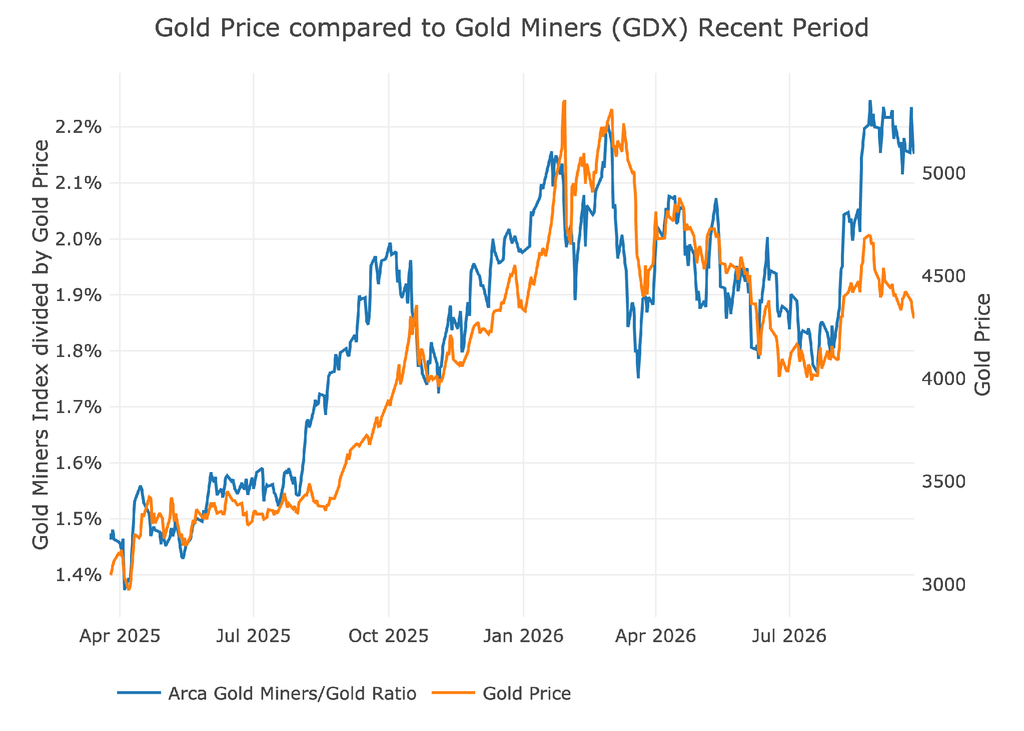
Figure: 13 Arca Gold Miners to Gold Current Trend
While the micro level does have the miners leading the metals, the long term chart shows that investors have fallen way out of love with the miners. The miners still have room to triple from here even if gold just holds where it is. Again, the recent hold-up can be seen here, albeit the scale makes it look small. If miners stay strong through Q4, it is very bullish for the yellow metal.
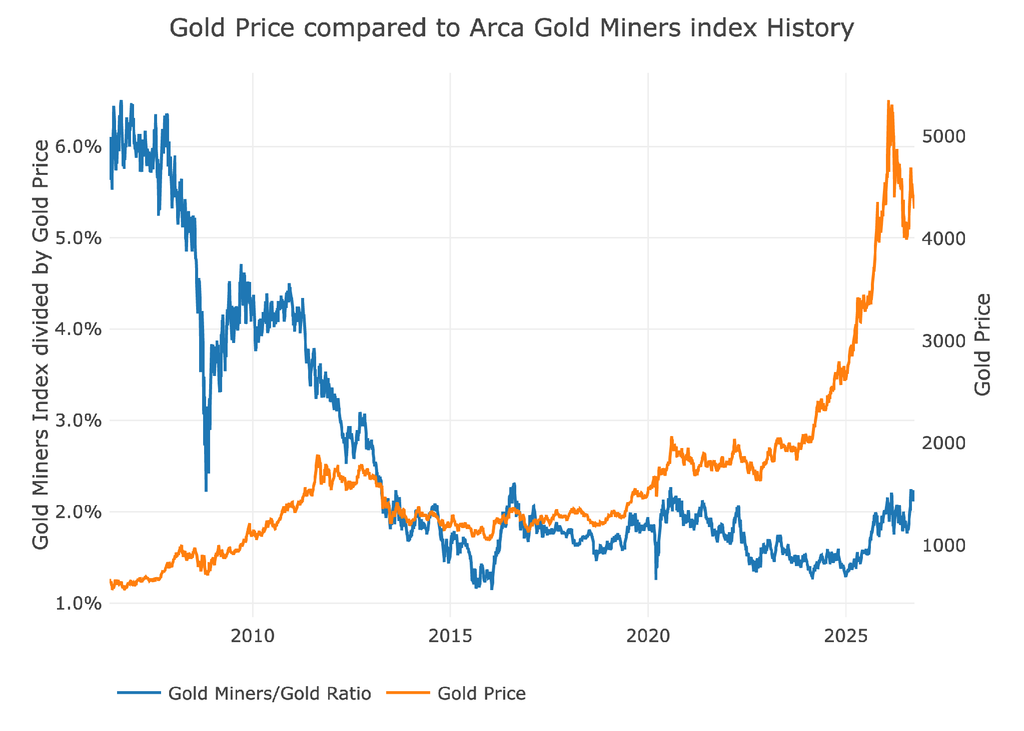
Figure: 14 Arca Gold Miners to Gold Historical Trend
Trade Volume
The next indicator is trade volume on the CME. This is related to, but not exactly tied to open interest. Higher trade volume with flat open interest can mean churn. Higher trade volume can also be met with increases or decreases in open interest if buyers or sellers are in control.
In gold, trade volume dropped but has recovered some. Again, this shows a lack of interest from the market speculators. Traders have been staying away from the market. If they were to re-enter, it would likely increase volatility but also drive prices higher. This is not a bearish chart for sure, but it also paints a picture similar to the price action. A holding pattern but likely a bullish result once action returns. Until then…
Outlook: Neutral
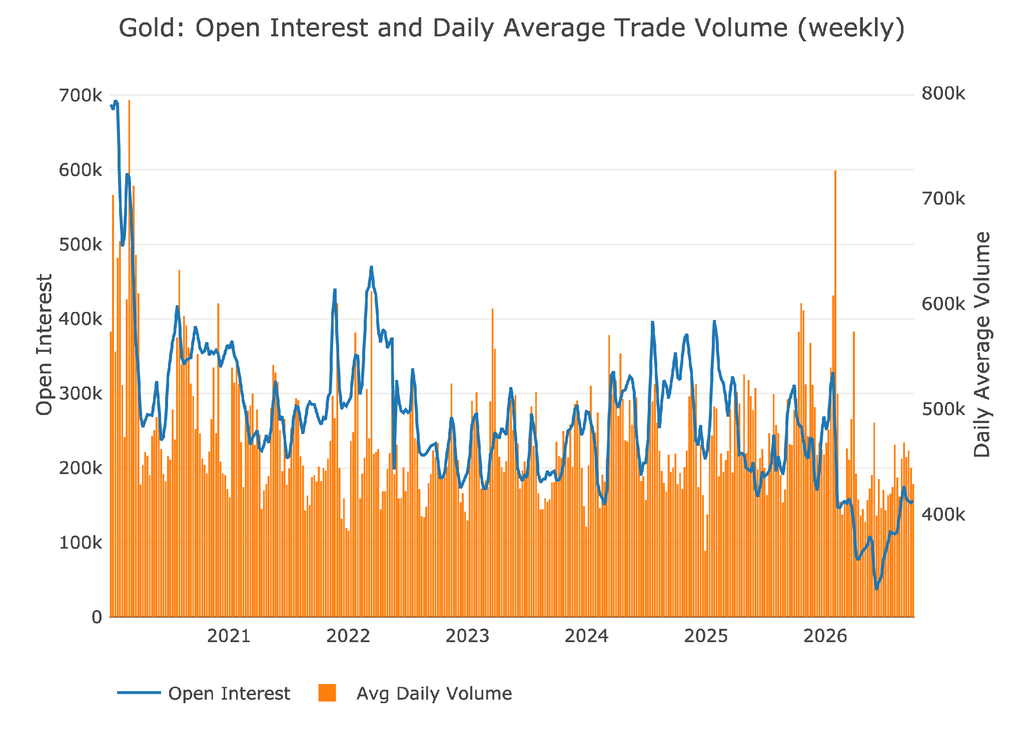
Figure: 15 Gold Volume and Open Interest
Silver trade volume saw a mini spike on the recent move until traders jumped out just as quickly as they jumped in. Similar call to gold, neutral for now, but when traders return they are likely to push prices up and not down.
Outlook: Neutral
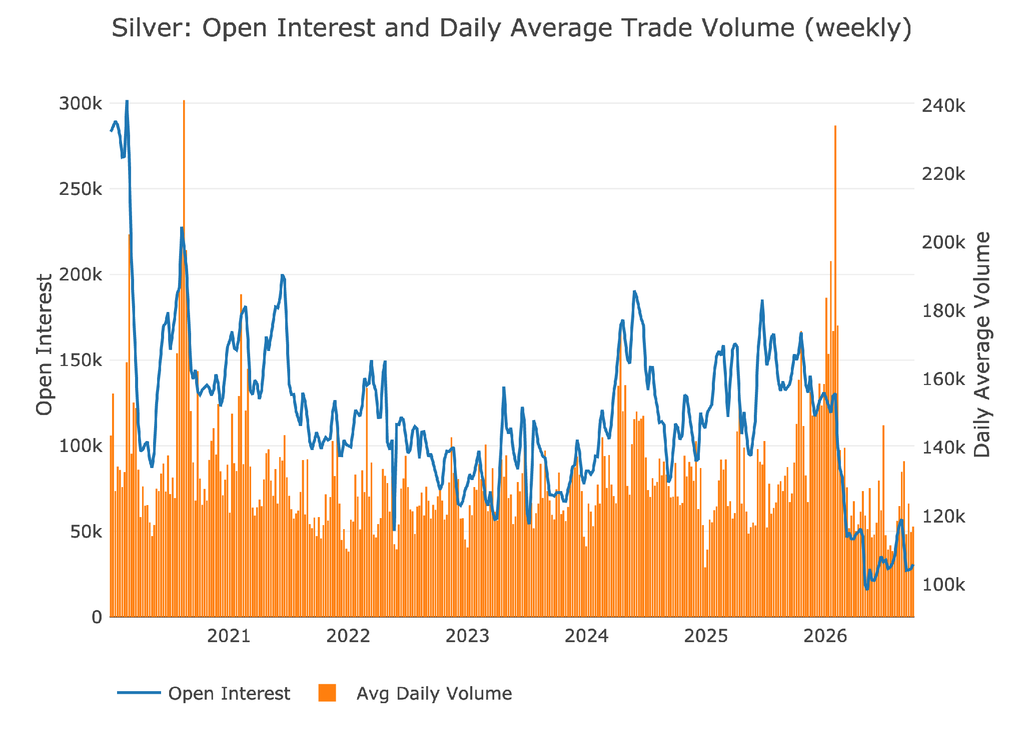
Figure: 16 Silver Volume and Open Interest
Other drivers
USD
Price action can be driven by activity in the US Dollar exchange rate. A big move up in gold will often occur simultaneously with a move down in the US dollar. The dollar is still hovering near 100 which is on the higher side over the last 20 years. The war in Iran has created a small rally in the Dollar, but less so than history would indicate.
Gold and silver have definitely been hit by the stronger dollar in recent weeks, capping the rally from August. That said, the fact the dollar has not caught a major bid with everything going on in geo-politics suggest that there may not be big buyers of dollars right now. This leaves more room to the downside, and thus more upside in gold.
Outlook: Bullish
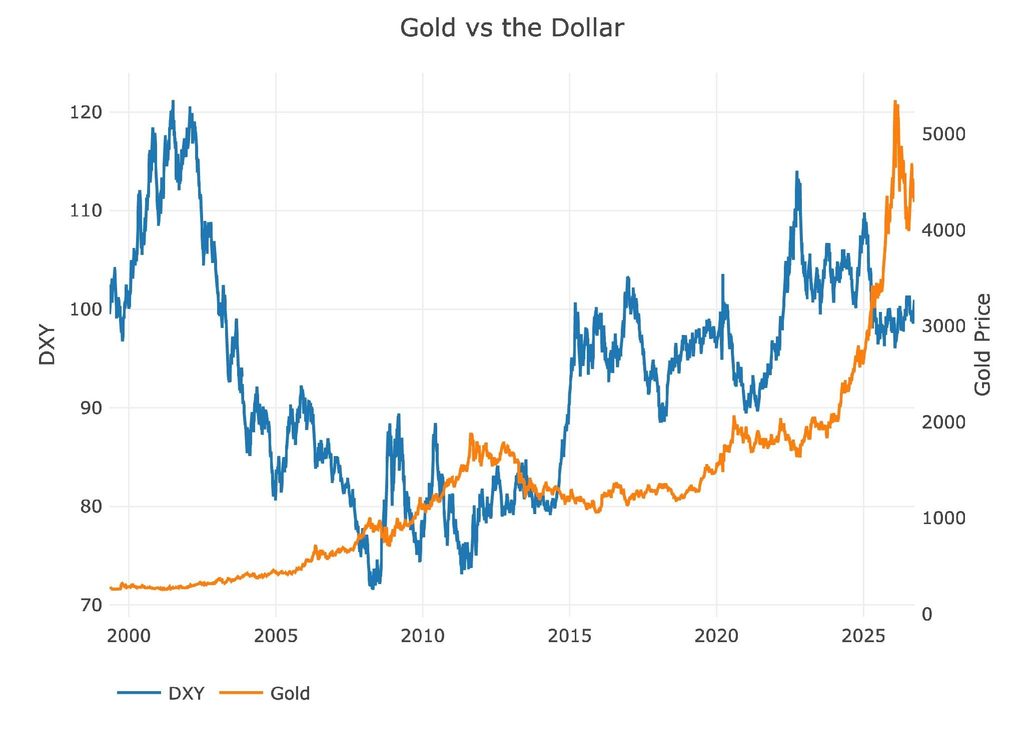
Figure: 17 Price Compare DXY and GLD
Gold Silver Ratio
The gold silver ratio collapsed as silver spiked. It went too far too fast. It has come back up some, but once again has not fully washed out sentiment. The gold silver ratio should be naturally lower than it has been the last 10 years, but it should get there more gradually than it did. It would be good to see this current area hold and for silver to build support against gold.
Outlook: Neutral
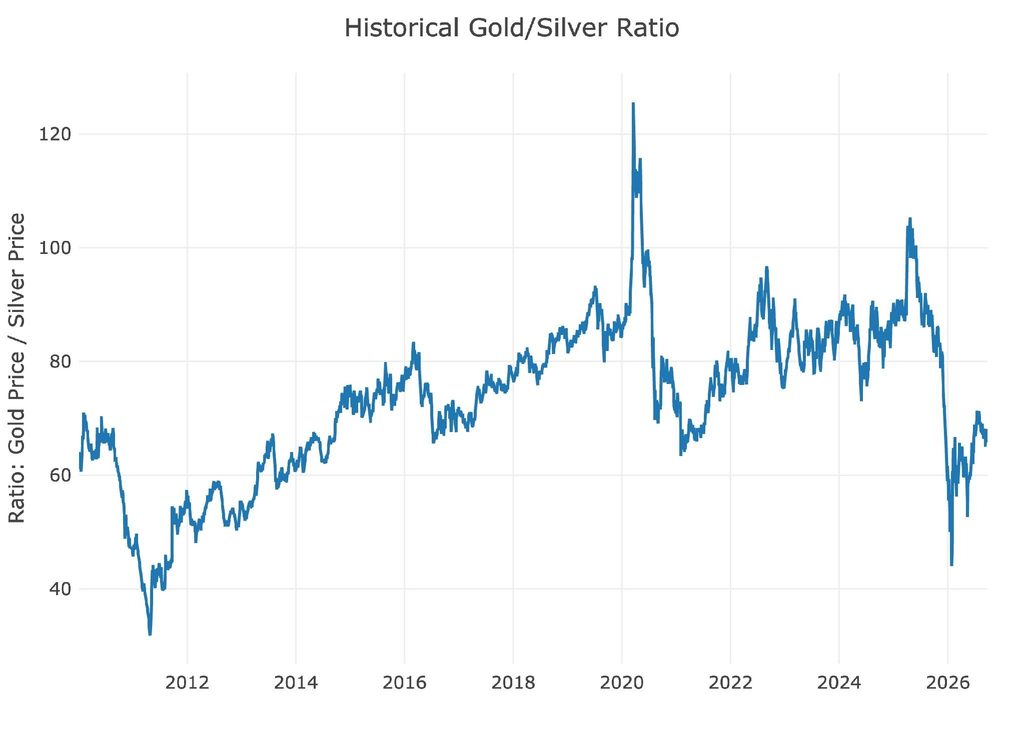
Figure: 18 Gold Silver Ratio
Gold Volatility Index
The GVZ is like the VIX for gold. It shows how the options traders are pricing the gold market. Right now, the indicator has come back down from the highs but remains above the historical averages. This means that traders are still pricing in volatility. Market makers are charging more for options which means they don’t think this neutral range will last. They expect a break in one direction or the other sooner rather than later.
Outlook: Neutral
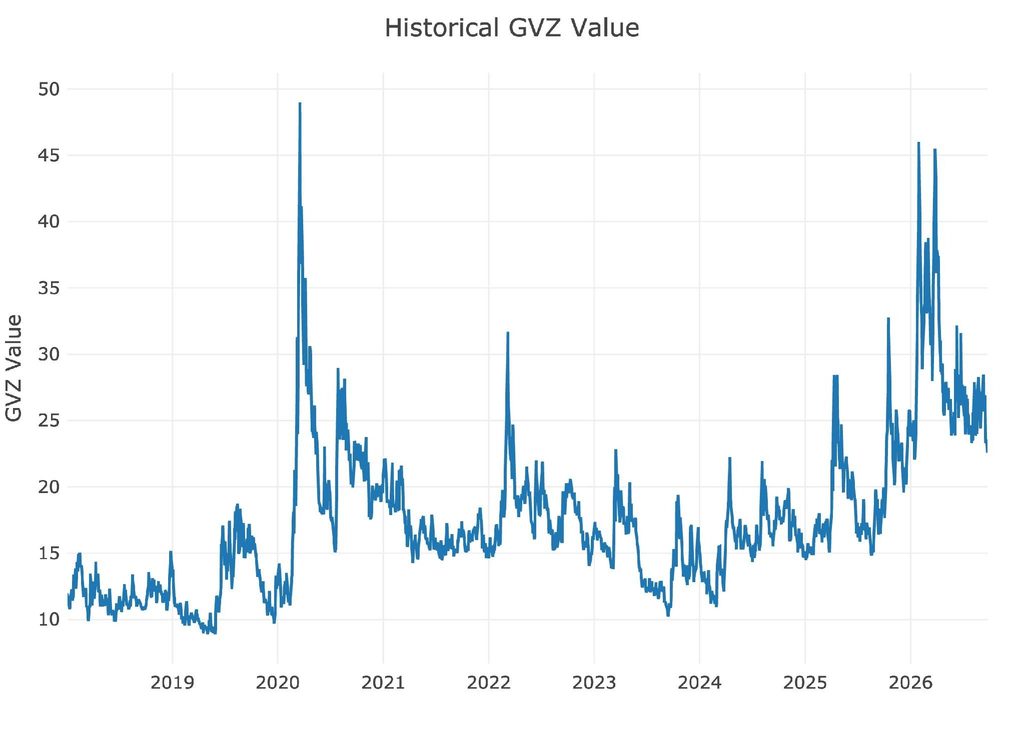
Figure: 19 Gold Volatility Index (GVZ)
Conclusion
In short, the market is consolidating but the time is ticking for gold to make a move higher. Otherwise buying interest could wane, the market drifts lower, and then support levels break which leads to a cascade of selling. While this is definitely a possible outcome, the more probable outcome appears to be higher and sooner. The miners are the clearest chart here. That will be your indicator. If GDX breaks $90 and then $85 it is likely a very bad sign and an indication that lows will be tested. If miners hold strong, they will be leading the metals higher sooner rather than later.
From a more fundamental perspective, the metals continue to absorb bad news very well. The initial nomination of Warsh created panic in a very frothy market. The dovish meeting in July triggered buying until Warsh finally made it clear that they would be raising rates. Gold has held strong and even rallied in the face of multiple more rate hikes expected. A lot of the bad news looks priced in. This means any waver from the Fed or desperate move from the Treasury could be exactly the thing that lights a fire back under gold and silver.
Downside probability is 25-30% with upside 70-75%. Always remember too that if the broader market gets hit, gold and silver will initially get caught in the cross currents and sell-off. That would likely be the best buying opportunity for years to come if it were to happen.

Receive SchiffGold’s key news stories in your inbox every week – click here – for a free subscription to his exclusive weekly email updates.
Interested in learning how to buy gold and buy silver?
Call 1-888-GOLD-160 and speak with a Precious Metals Specialist today!
 Live Chat
 Email:
  Phone: 1-888-465-3160