
Government Deficit Reaches $2T in Fiscal Year 2026
Federal Budget
The Federal Government publishes the spending and revenue numbers on a monthly basis. The charts and tables below give an in-depth review of the Federal Budget, showing where the money is coming from, where it is going to, and the surplus or deficit.
The government fiscal year closed in September, but this analysis will look at the calendar year budget. As shown below, the deficit over the last 5 months has been very large.
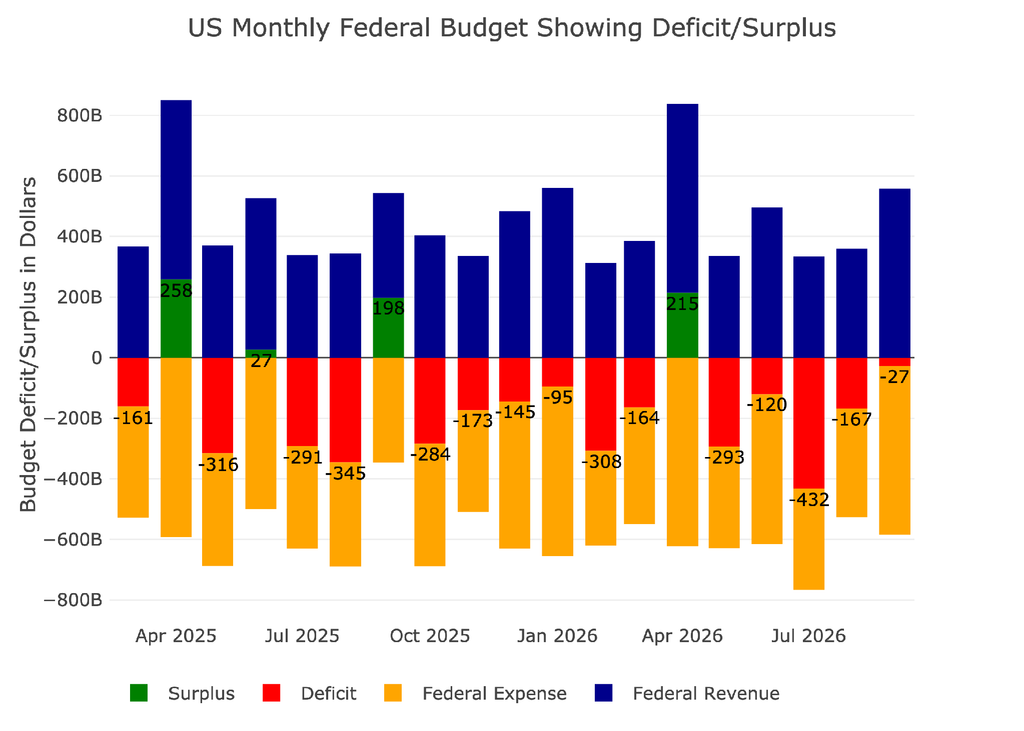
Figure: 1 Monthly Federal Budget
Looking at the average monthly deficit, July was significantly worse than average, August was actually a bit better than average. September has historically been a very small deficit month and was again this year.
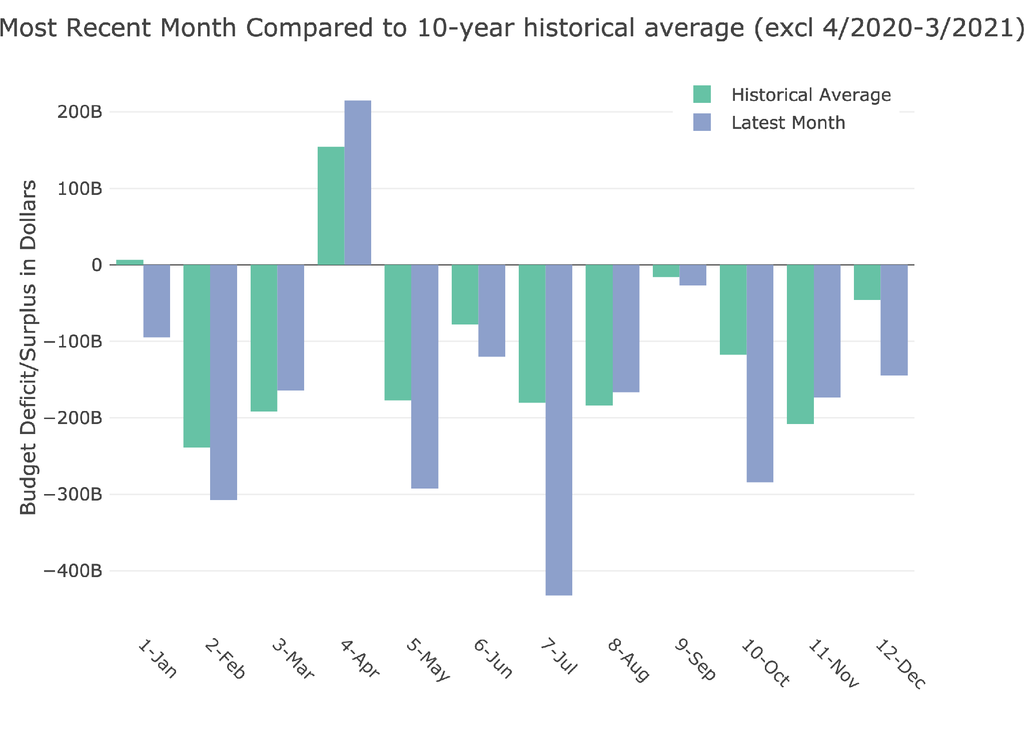
Figure: 2 Current vs Historical
We can look at the latest quarter in aggregate using the Sankey diagram below that shows a massive $626B deficit for the quarter. That would annualize to more than $2.4T a year! Completely unsustainable.
Ironically, in this quarter, the Net Interest Expense has fallen to the 5th largest item in the budget. Interest alone still cost the US Government $225B for the quarter, annualizing to $900B.
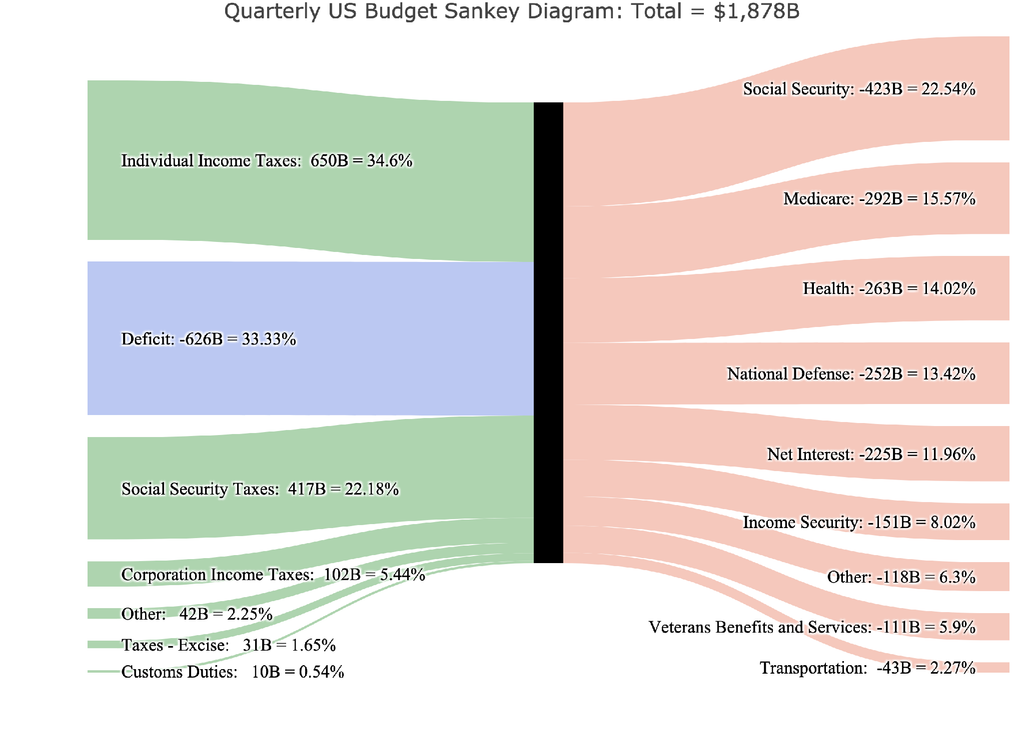
Figure: 3 Quarterly Federal Budget Sankey
The $626B deficit this quarter is the largest single quarter deficit since Q4 2024. It is scary to think that 4 of the last 5 quarters had a deficit that exceeded $400B, with three of them exceeding $550B.
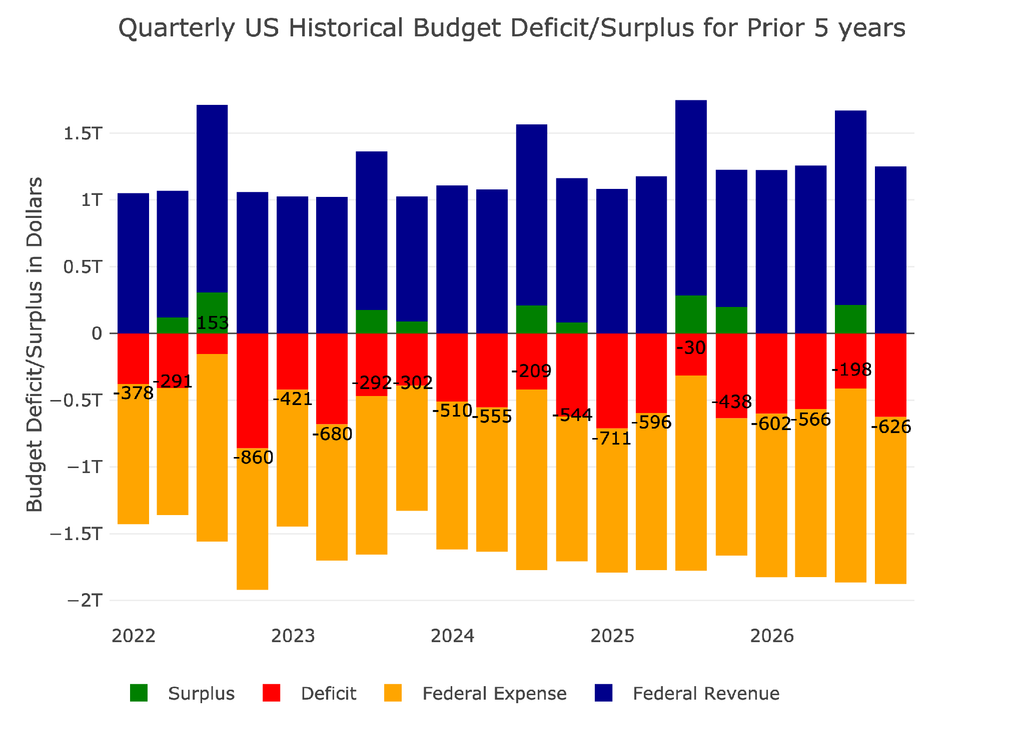
Figure: 4 Quarterly Historical Deficit/Surplus for Previous Five Years
The next two charts show the quarterly revenue and costs broken down by expense type. You can see how the revenue this quarter is almost exactly the same as it was in Q1. You want to see revenues increasing over time, but trajectory has flattened out over the last 5 quarters (excluding Q2 which is the tax revenue quarter).
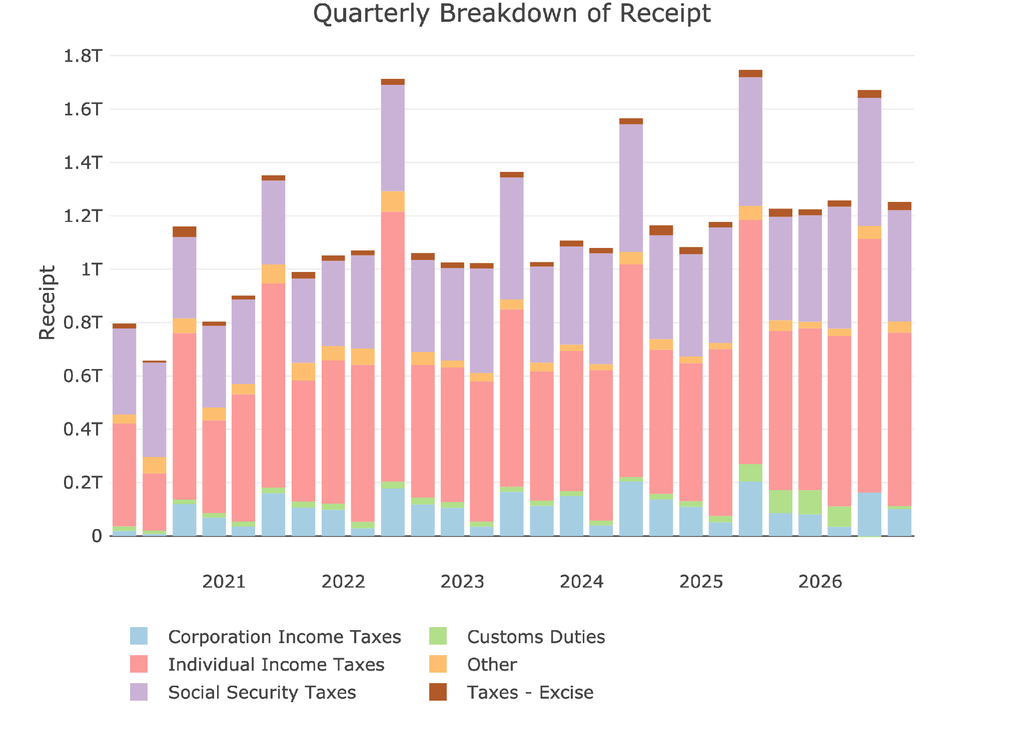
Figure: 5 Quarterly Receipts
On the flip side, you can see that spending continues the trend of getting worse. This quarter was only slightly worse than last quarter, but that was helped by a fall in interest expense of more than $80B (it was $308B last quarter).
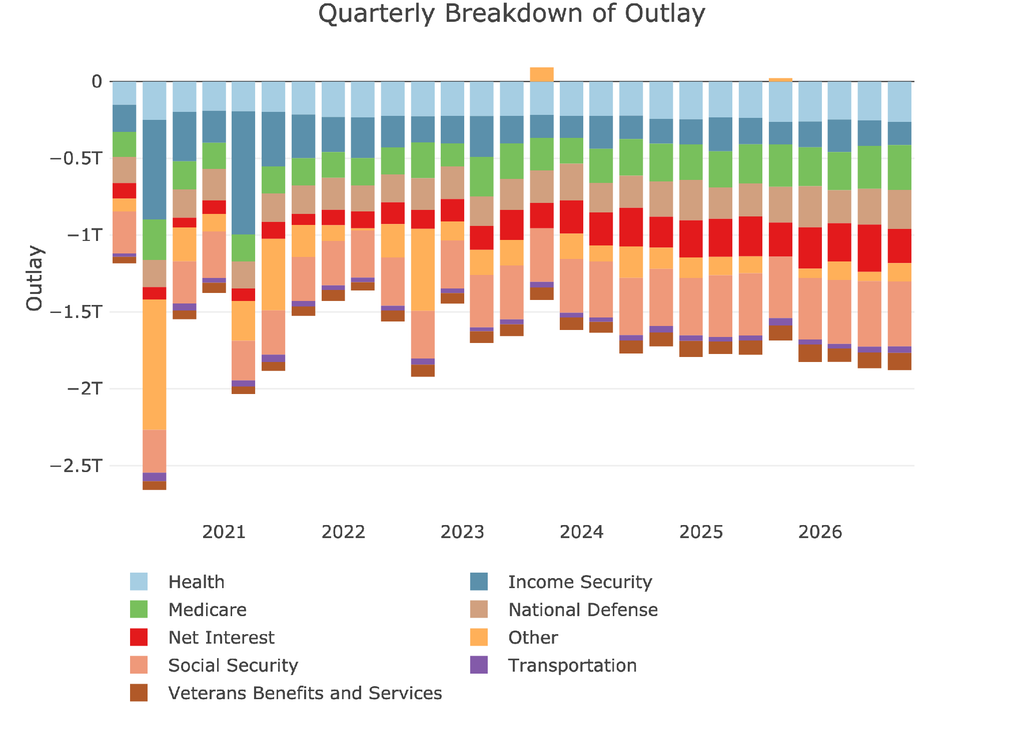
Figure: 6 Quarterly Outlays
Interest Expense has ballooned higher to $1.05T on a trailing twelve-month basis. This is deadly for the budget. With the Fed currently raising rates and interest rates skyrocketing, this is only going to get worse. The death spiral has already started for the US government.
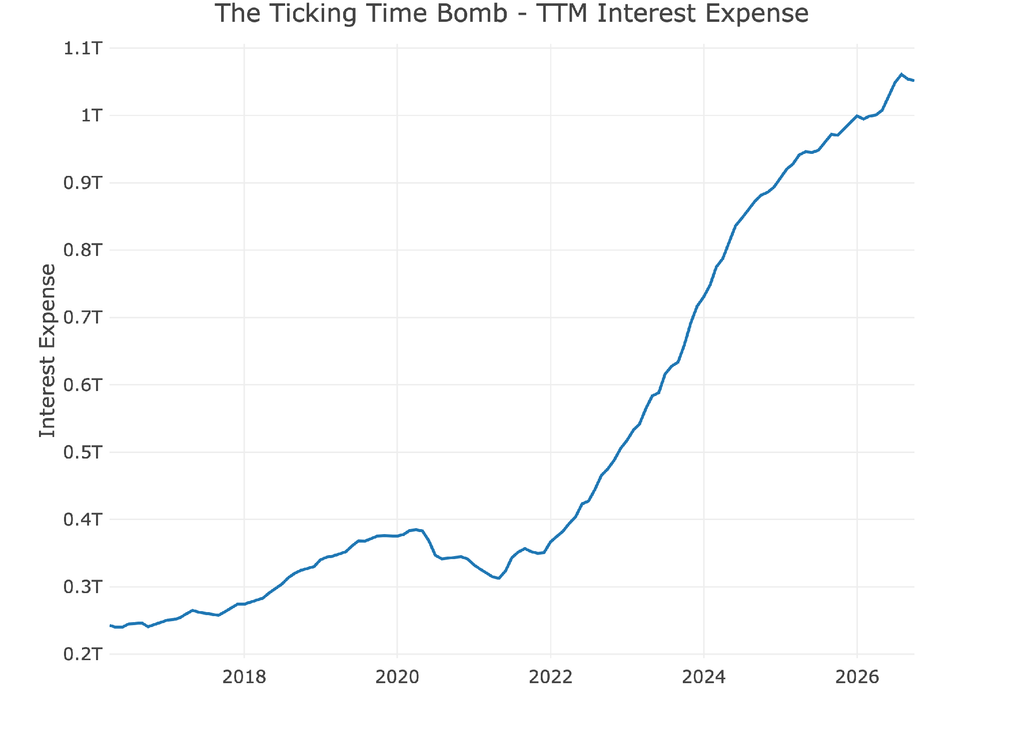
Figure: 7 TTM Interest Expense
Historical Perspective
Zooming out and looking over the history of the budget back to 2015 shows a more complete picture. The change since Covid is quite dramatic. In September 2019, the TTM deficit was $984B. As of September last year, it was $1.77T. The most recent TTM deficit was $1.99T. This is a 12.4% YoY increase in the deficit. This is completely unsustainable and will get significantly worse if rates just stay where they are, not to even mention if rates keep going up.
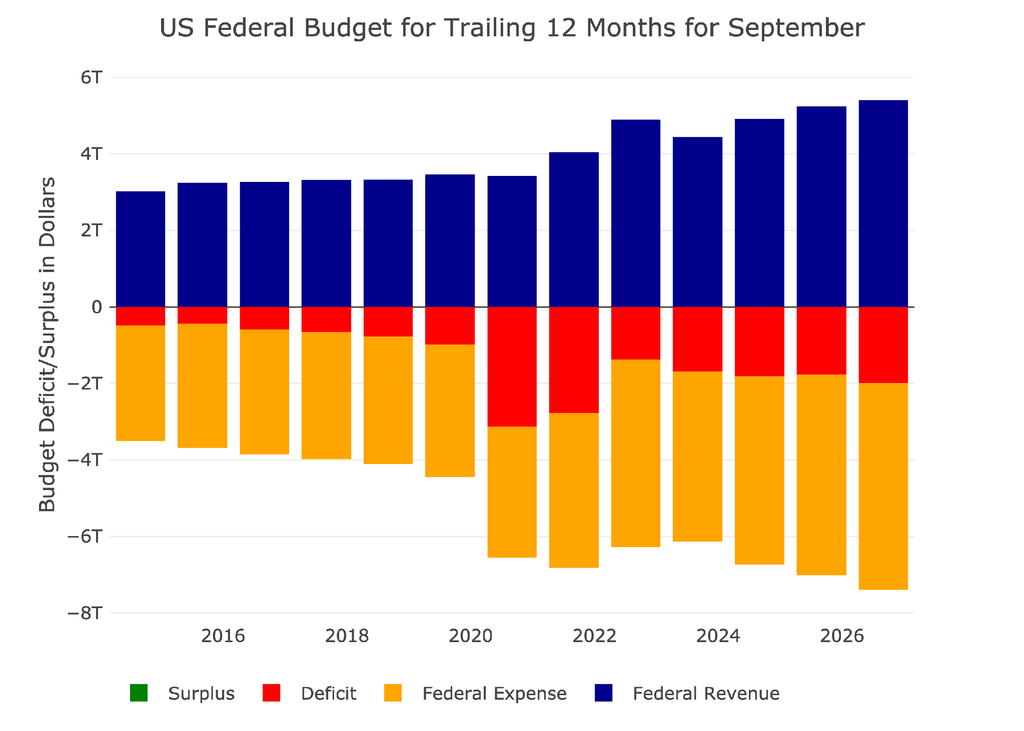
Figure: 8 Trailing 12 Months (TTM)
The next two charts zoom in on the recent periods to show the change when compared to pre-Covid. These charts show spending and revenue on a trailing 12-month basis period over period.
The last 12-months saw a 3.3% increase in revenue. This was mainly driven by an increase in individual taxes.
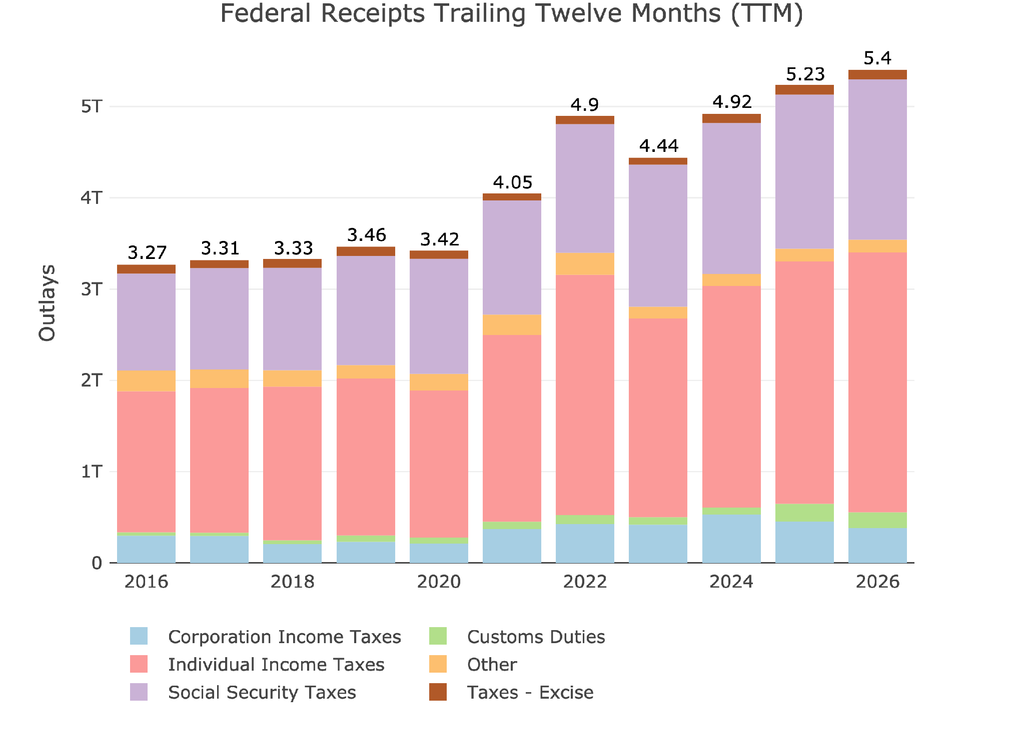
Figure: 9 Annual Federal Receipts
The spending chart really shows the impact of the growing interest expense (the red bar). Spending increased by 5.5%. This is why the deficit is getting so much worse YoY. Spending is just growing much faster than revenue.
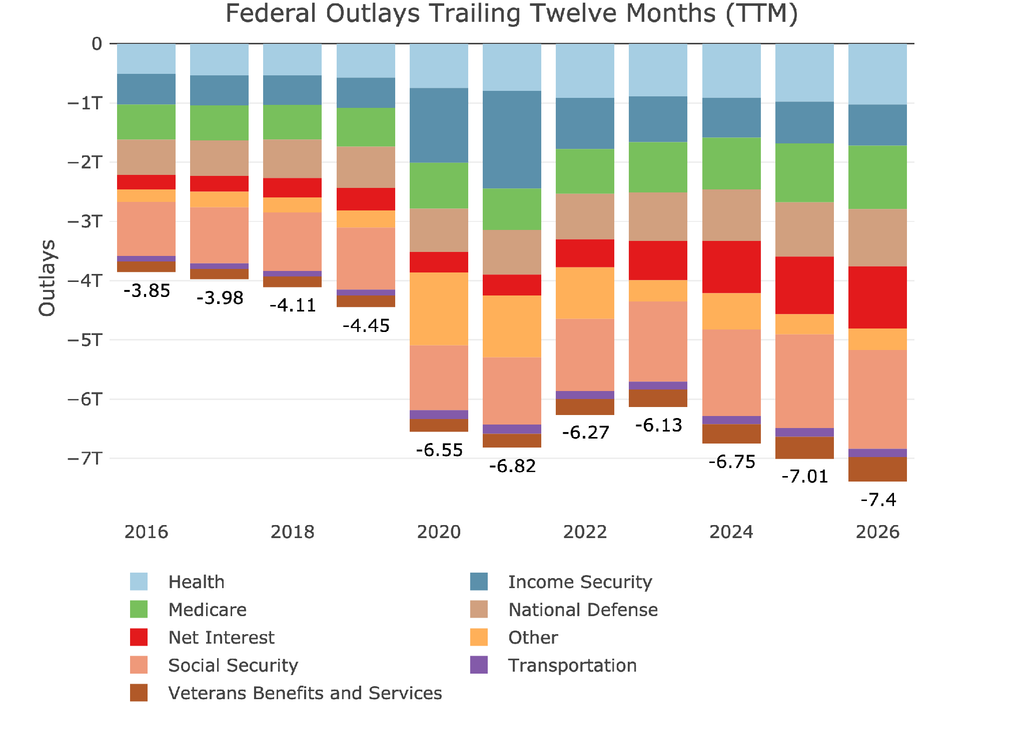
Figure: 10 Annual Federal Expenses
Finally, we finish with a Sankey showing TTM Deficit was -$1.99T which is a massive issue going forward, representing 26.9% of all government spending. Net Interest is the fourth biggest line item when looking at the full year.
Buckle up. This has been a slow-moving train wreck for years, but it is starting to accelerate
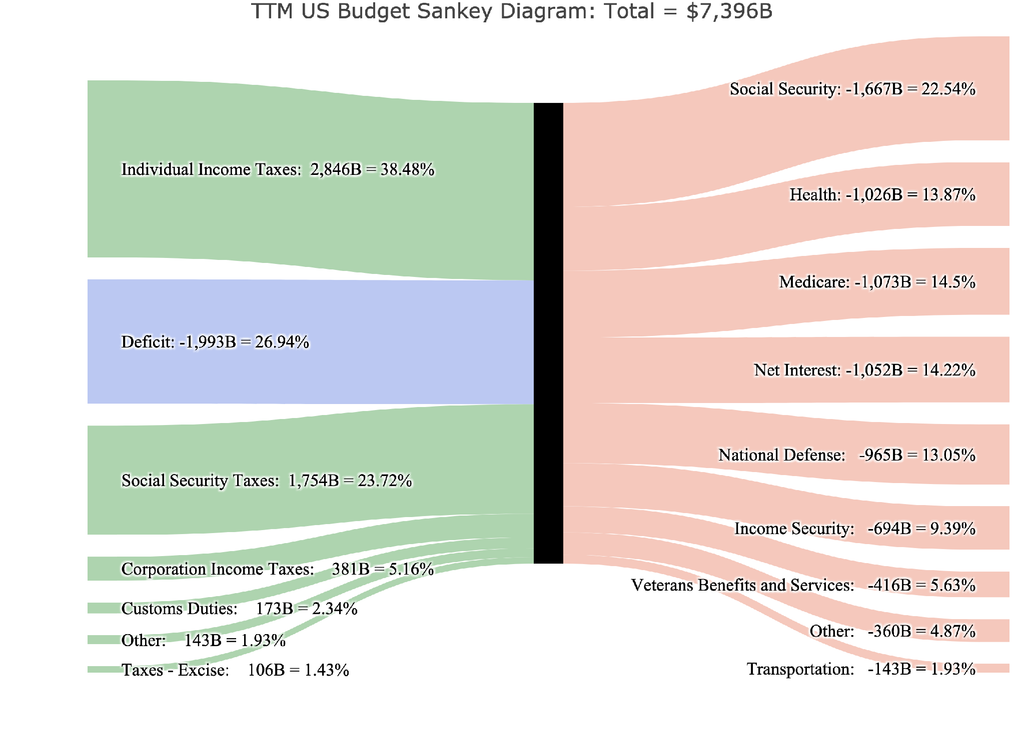
Figure: 11 TTM Federal Budget Sankey

 Live Chat
 Email:
 Phone: 1-888-465-3160