
Household Survey Shows 500k Jobs Lost in June while Labor Force Participation Crashes to Multi-year lows
The analysis below covers the Employment picture released on the first Friday of every month. While most of the attention goes to the Headline Report, it can be helpful to look at the details, revisions, and other reports to get a better gauge of what is really going on.
Current Trends
The jobs report showed a gain of 57k jobs for the month of June. That was half of market expectations which has prompted an early rally in the market and specifically gold and silver. Perhaps the bigger news is the Household Survey which showed a whopping loss of 507k jobs. That is a major loss, the second largest in a year for the household survey.
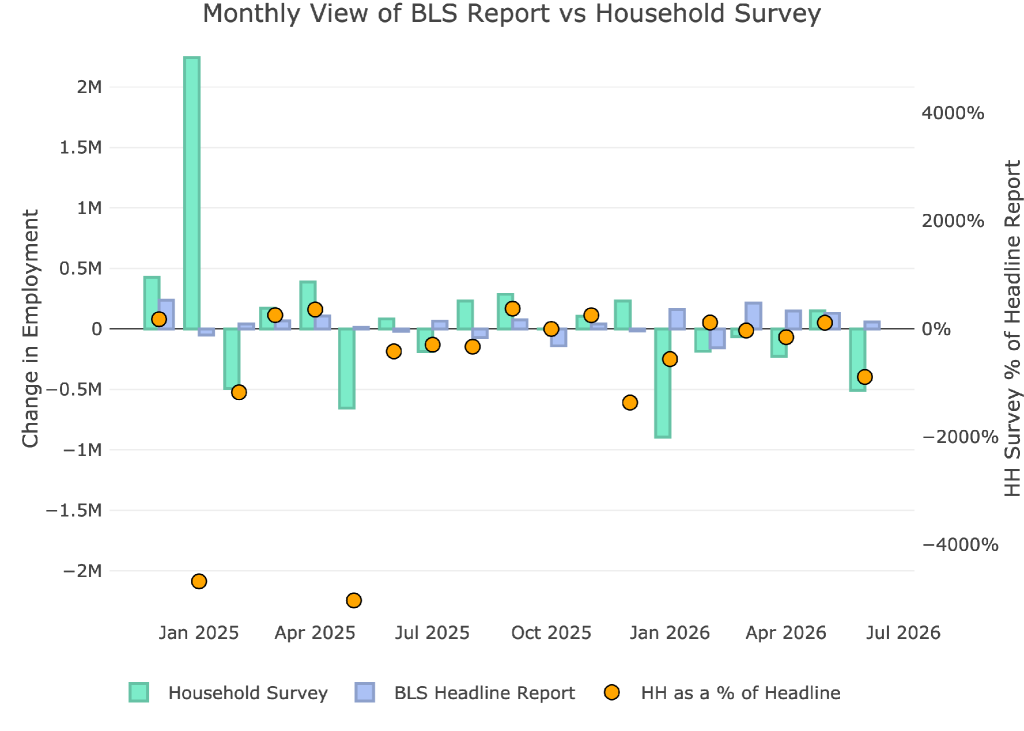
Figure: 1 Primary Report vs Household Survey – Monthly
When looking at the yearly numbers, the Household Survey paints an even worse picture. While the Headline Report shows a gain of 557k, the Household Survey shows a loss of 1.7M. That is a massive difference exceeding 2M! Those are painting very different pictures of the US economy.
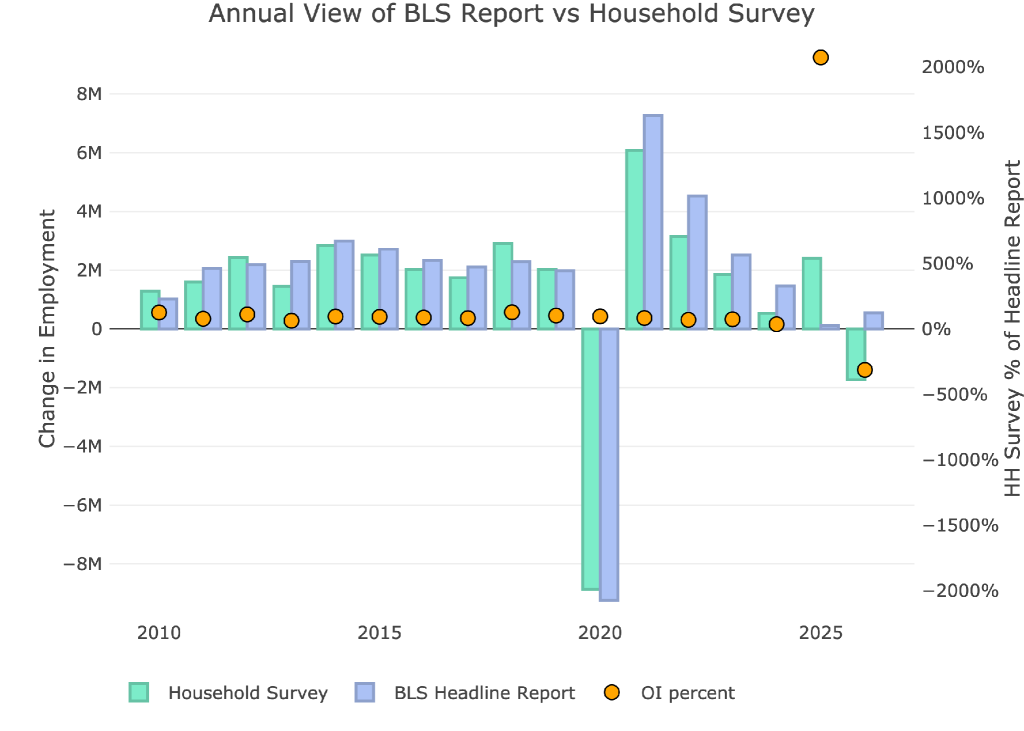
Figure: 2 Primary Report vs Household Survey – Annual
The BLS publishes the data behind their Birth/Death assumptions (formation of new business). The data showed that the BLS assumed a gain of 8,000 jobs for the month of June which is essentially zero.
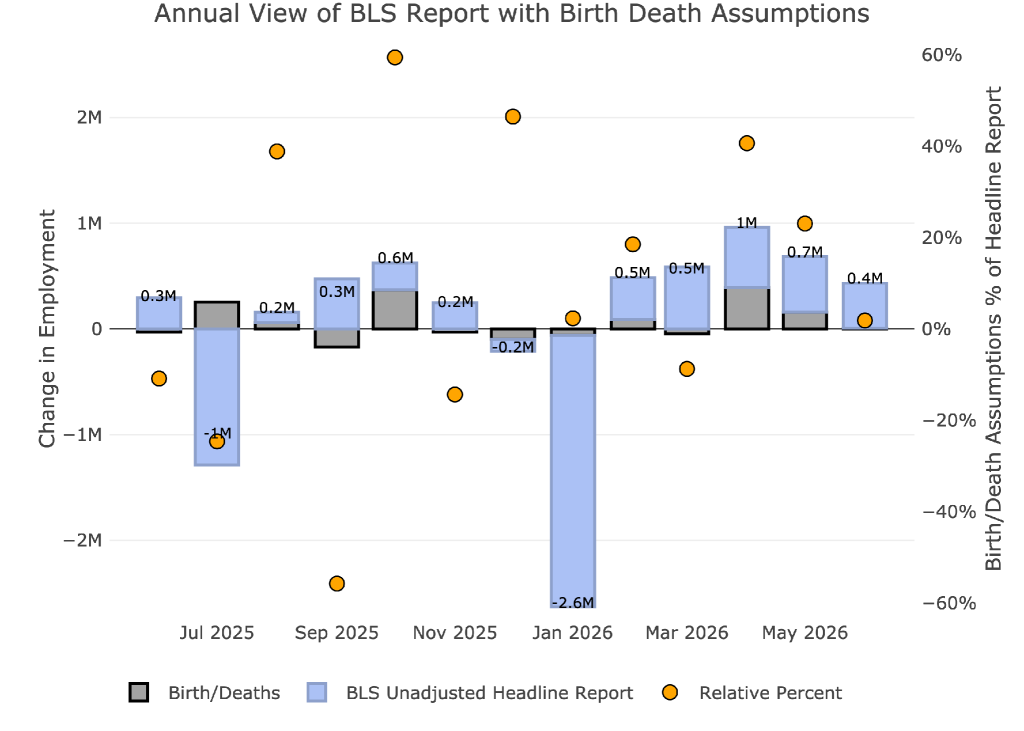
Figure: 3 Primary Unadjusted Report With Birth Death Assumptions – Monthly
We are now in the second year of a situation where assumed births is positive while the actual jobs created are negative. This means that BLS continues to assume job growth through business birth while the rest of the economy sheds jobs. This is the difference between assumed jobs and actual jobs.
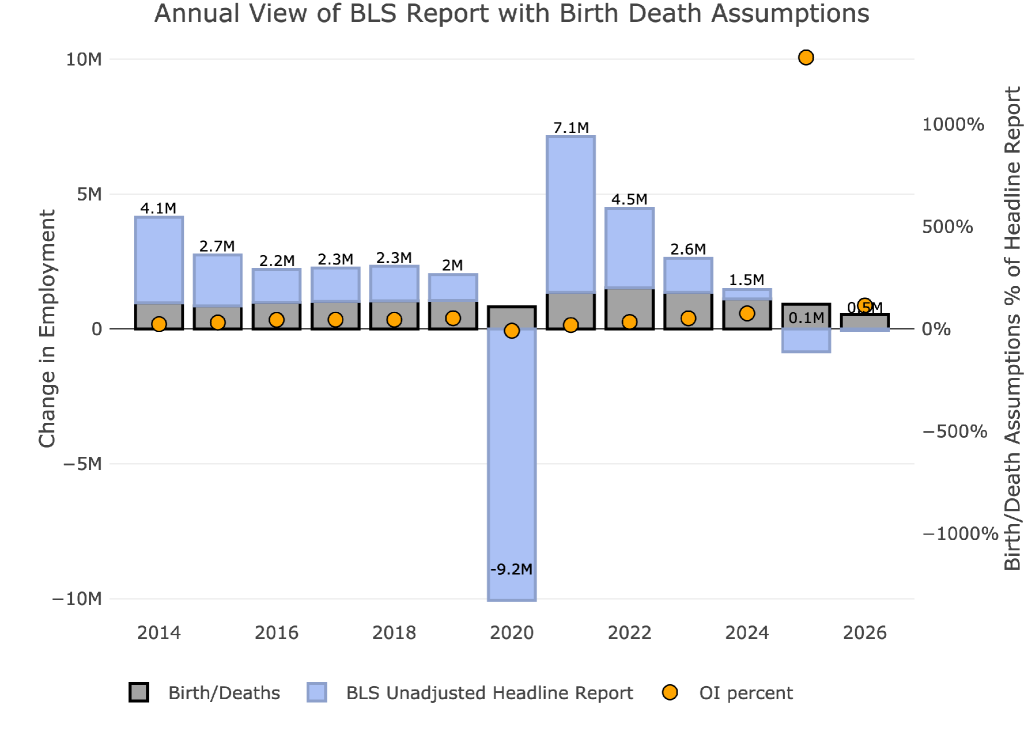
Figure: 4 Primary Unadjusted Report With Birth Death Assumptions – Monthly
Digging Into the Headline Report
Unfortunately, despite being highly unreliable, the Headline report is the best data we have for the more recent periods. Furthermore, this is the data the Fed uses to shape its policy. Even though Warsh is trying to be more discreet about how the Fed is going to work, the jobs number still holds a lot of weight at the Fed.
The 57k jobs gained actually came with a drop in the unemployment rate to 4.2%, down from 4.3% last month and 4.5% last November. This is the lowest unemployment rate since last June.
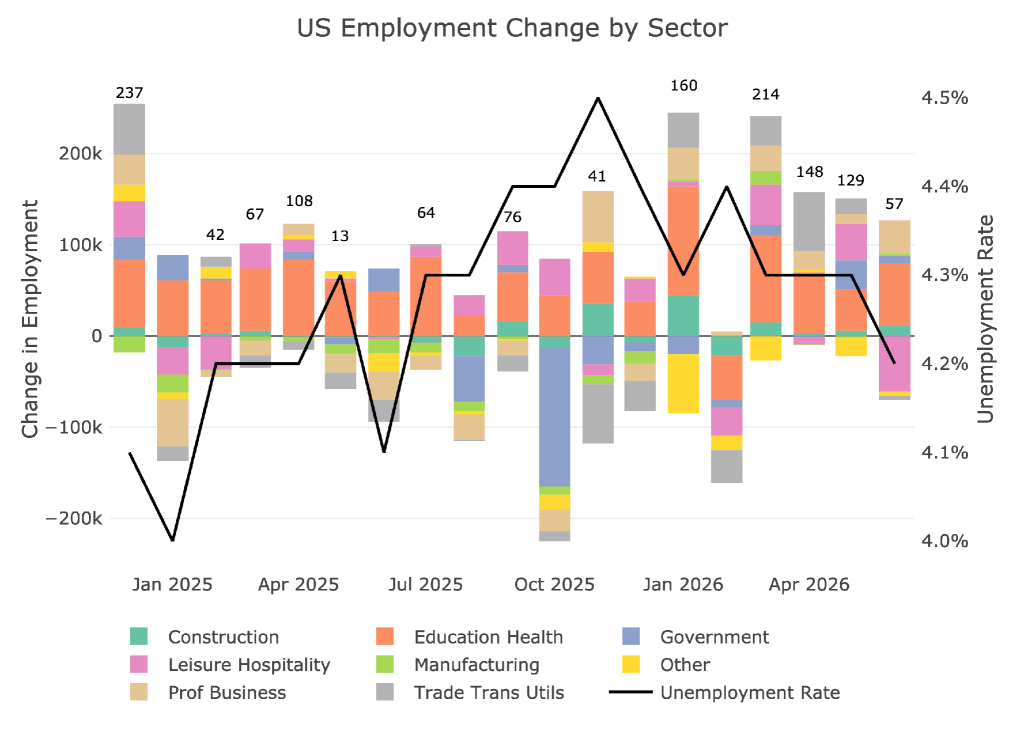
Figure: 5 Change by sector
Jobs by Category
Despite the meager job gains, the losses were concentrated in Leisure and Hospitality. Six of the eight categories were actually above the 12-month trend. Trade, Transport, and Utils was the only other category below trend.
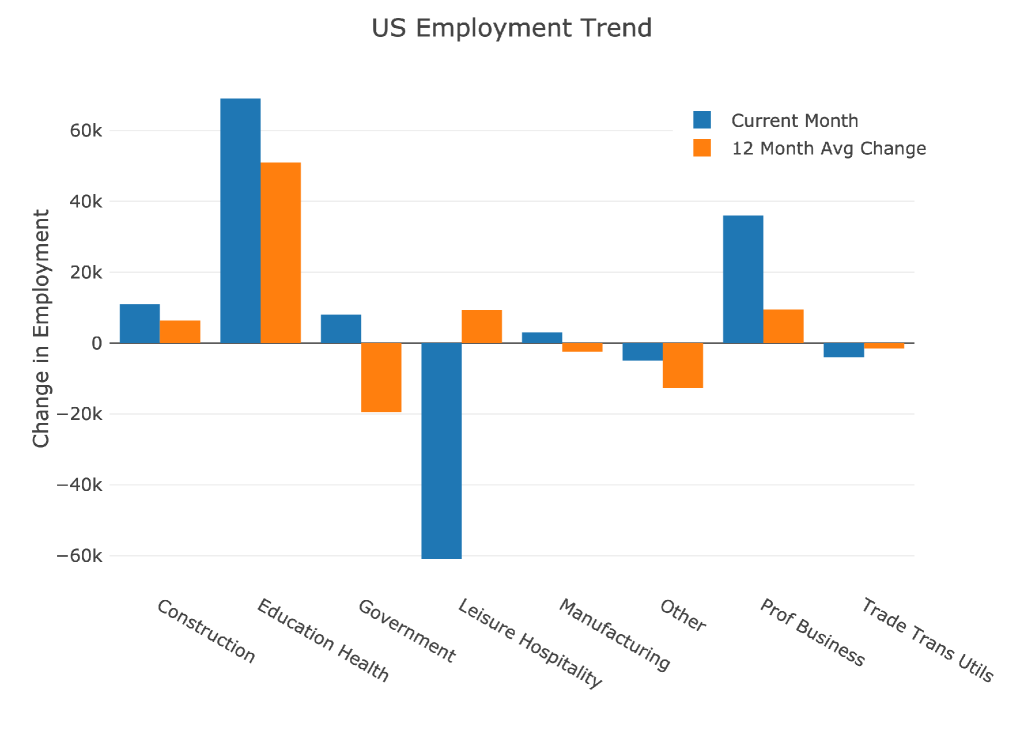
Figure: 6 Current vs TTM
The table below shows a detailed breakdown of the numbers.
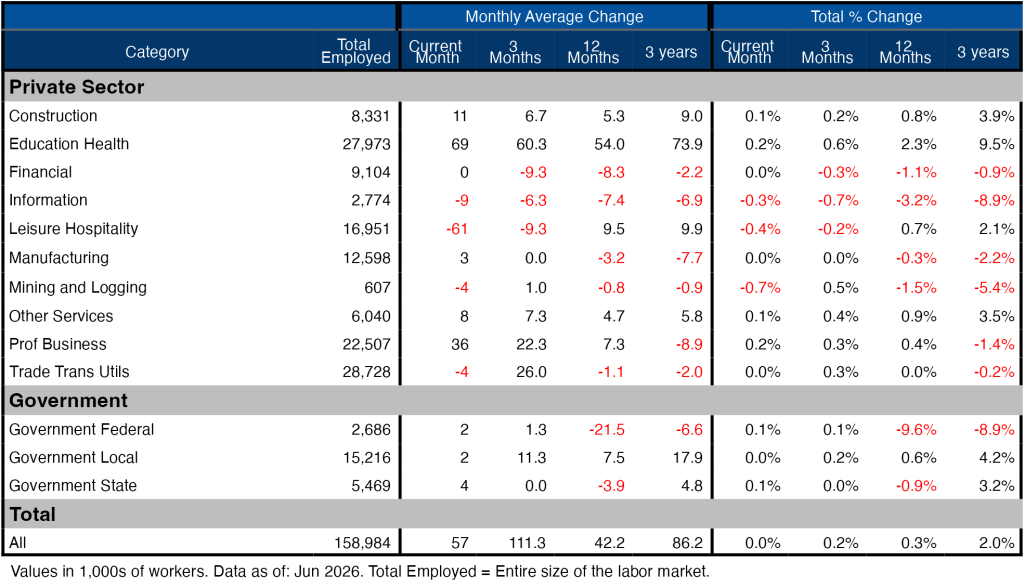
Figure: 7 Labor Market Detail
Revisions
This is the biggest story of the jobs report. After all the revisions, the job picture is significantly bleaker than the data originally showed. Ironically, we have seen some positive revisions recently but that ended in the month of May where jobs were revised down by almost 50k.
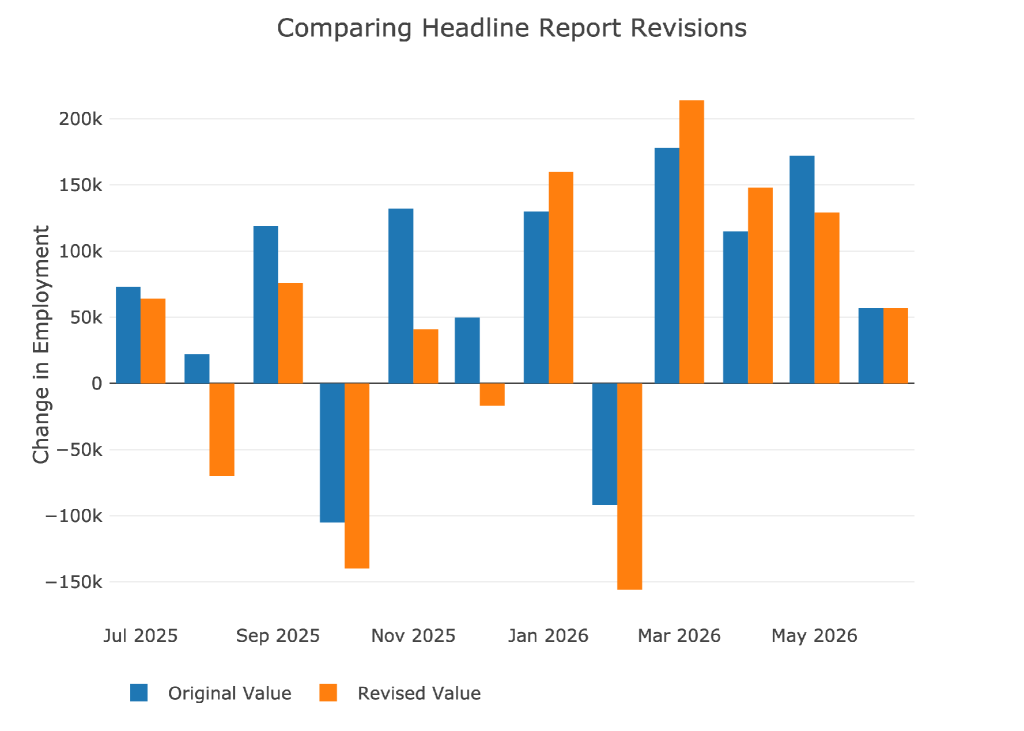
Figure: 8 Revisions
Over the last twelve months, jobs have been revised down by about 50k per month! The past three months show the opposite trend with job revisions positive by about 50k.
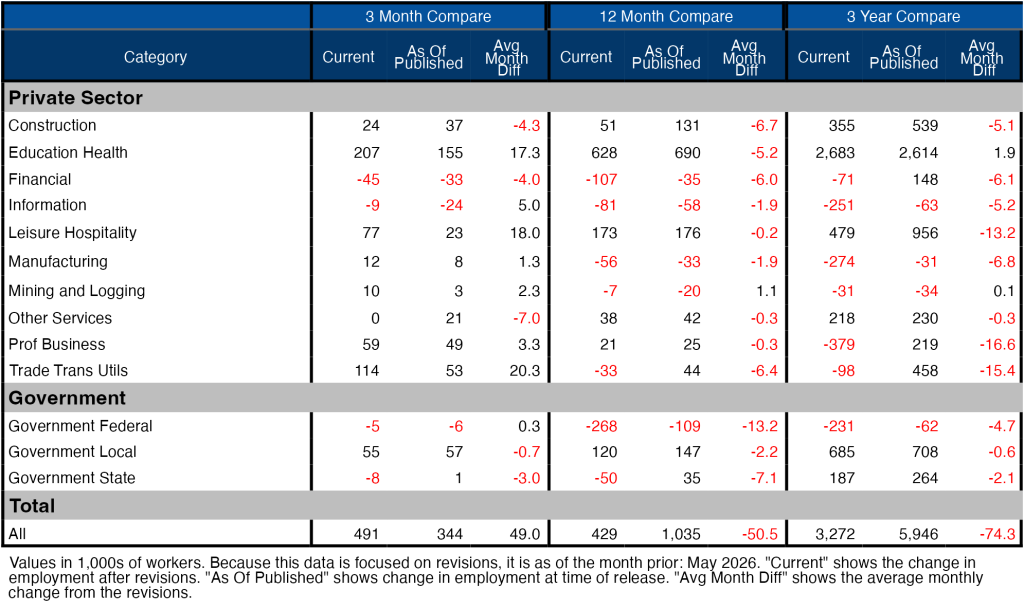
Figure: 9 Revisions
More Detail in the Household Survey
Another level of detail in the Household report shows full-time vs part-time job holders. The data shows full-time and part-time jobs being lost in June.
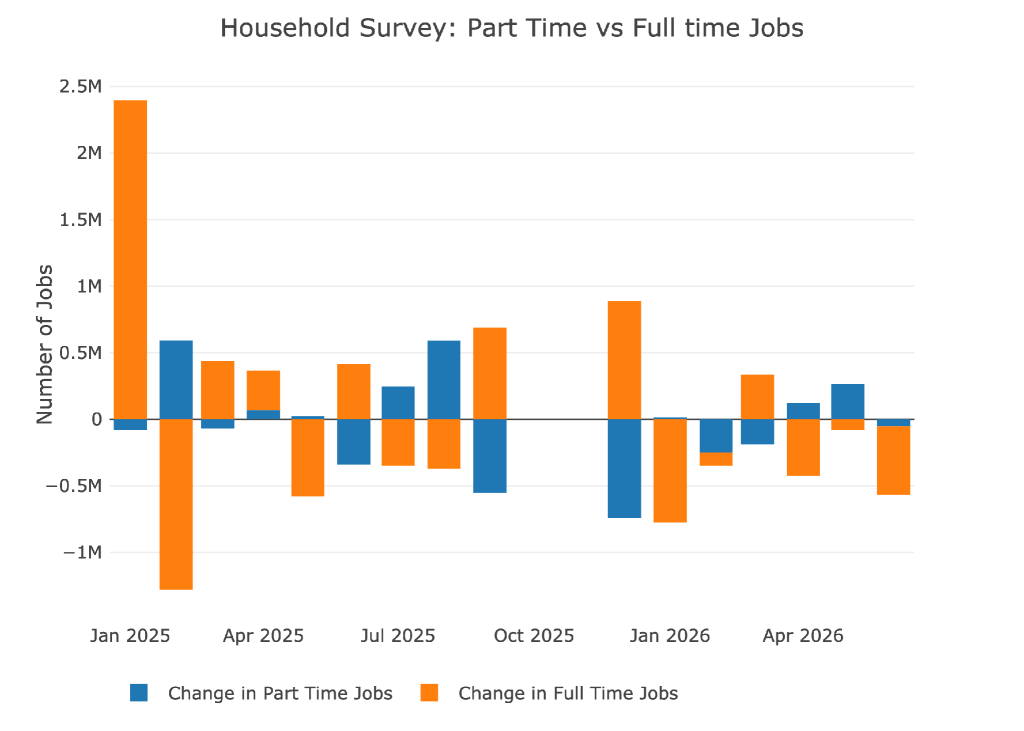
Figure: 10 Full Time vs Part Time
Historical Perspective
The chart below shows data going back to 1955.
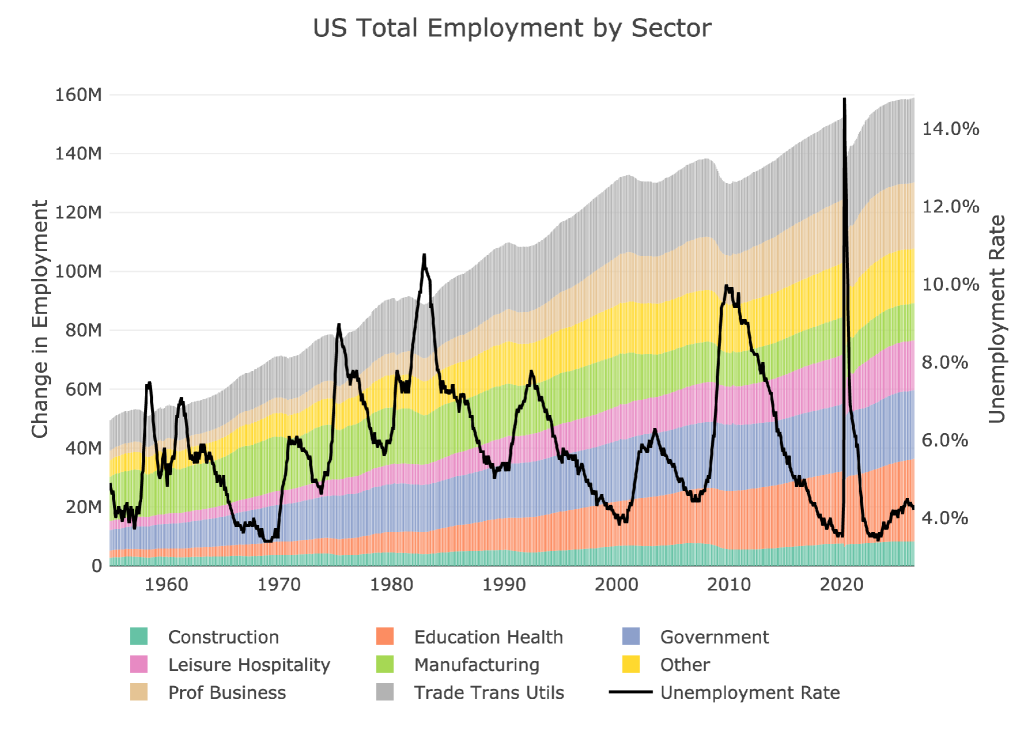
Figure: 11 Historical Labor Market
The labor force participation rate is still well below the highs before the Global Financial Crisis. This month showed it collapsing to 61.5%, the lowest level since March 2021. As recently as November of last year, the participation rate was 62.5%. This is a very notable trend and worth watching in the months ahead.
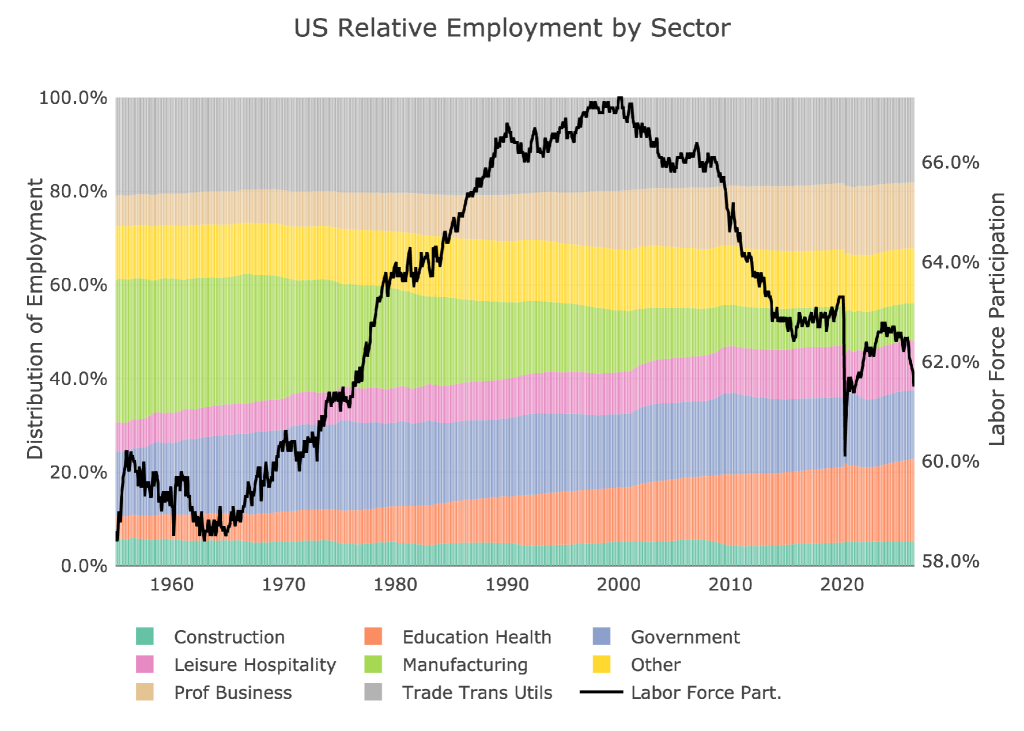
Figure: 12 Labor Market Distribution
Conclusion
Today’s job report was on all accounts very weak:
- Half the expected value
- Household Survey showed half a million job losses
- Last month revised down
- Labor force participation falls to multi-year lows
Warsh felt confident talking tough on inflation with a strong job market, but the data has taken this away as a crutch. This is why gold and silver are rising today. The market is already looking past the tough talk to the real next move of the Fed: easy money. The math on the debt makes this an obvious story, but Warsh was able to distract the market. Maybe he can keep the game going a bit longer, but eventually, the math becomes the math. With a weaker job market, he has an easy excuse to pivot.

Receive SchiffGold’s key news stories in your inbox every week – click here – for a free subscription to his exclusive weekly email updates.
Interested in learning how to buy gold and buy silver?
Call 1-888-GOLD-160 and speak with a Precious Metals Specialist today!