
Even After Three Strong Household Survey Reports, the YTD Number is Still Negative
The analysis below covers the Employment picture released on the first Friday of every month. While most of the attention goes to the Headline Report, it can be helpful to look at the details, revisions, and other reports to get a better gauge of what is really going on.
Current Trends
The jobs report showed a modest gain of 165k jobs in the month of October. Although this beat expectations (albeit very low expectations), it is still below what you would expect to see in a strong job market which is 200k+. It was surprising to see another strong Household Survey report of 463k jobs. This is the third month in a row where the Household Survey reported more than 400k jobs.
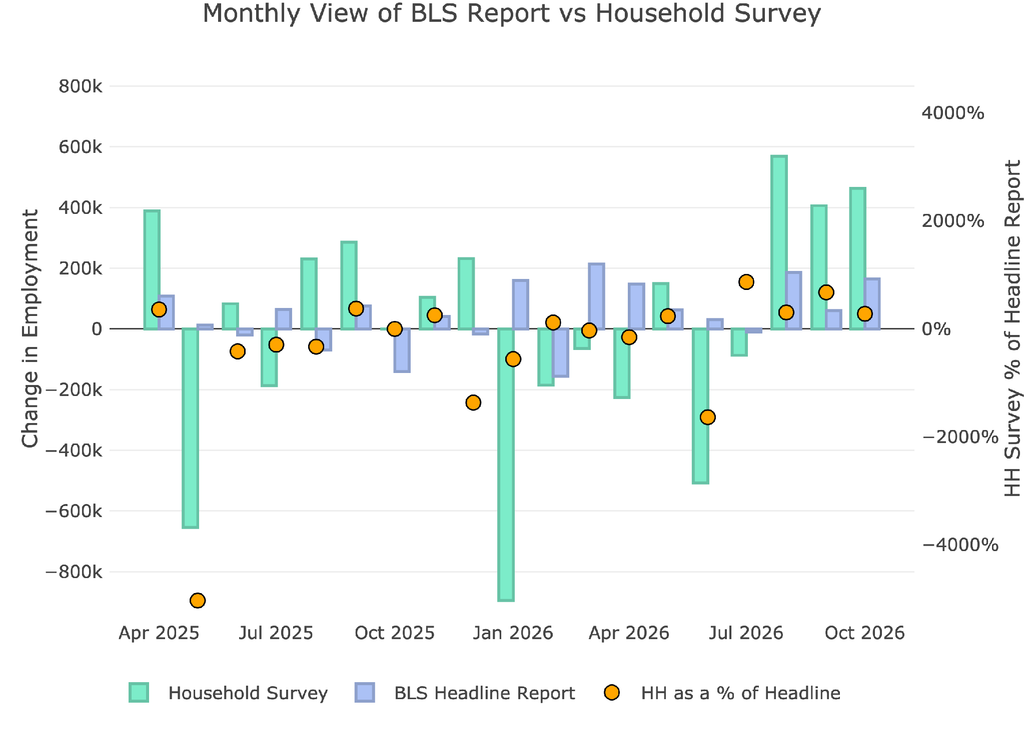
Figure: 1 Primary Report vs Household Survey – Monthly
Despite the extremely strong Household Survey for three months, when looking at the YTD number, it is still negative. For the year, the Headline Report shows a gain of 861k vs the Household Survey which shows a loss of 377k. Outside of Covid, this is the worst year in the Household Report since at least 2010. It’s also the only year where the two reports are moving in opposite directions.
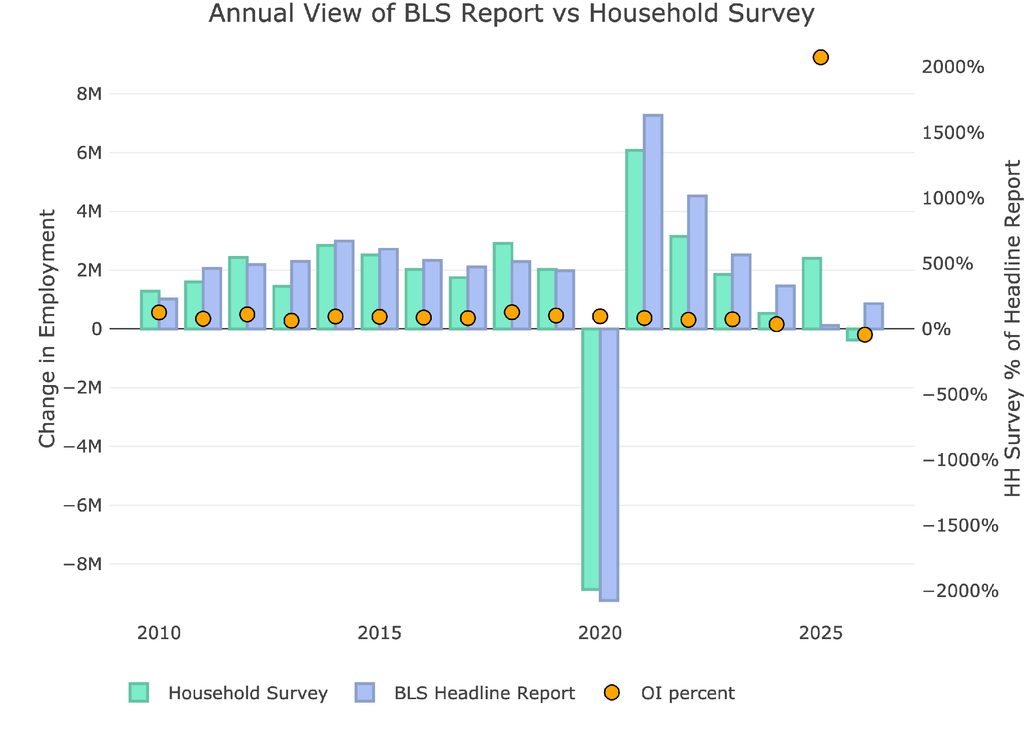
Figure: 2 Primary Report vs Household Survey – Annual
The BLS publishes the data behind their Birth/Death assumptions (formation of new business). The data showed that the BLS assumed a gain of 412k jobs for October. This is the largest month of assumed job growth for at least the last 13 months.
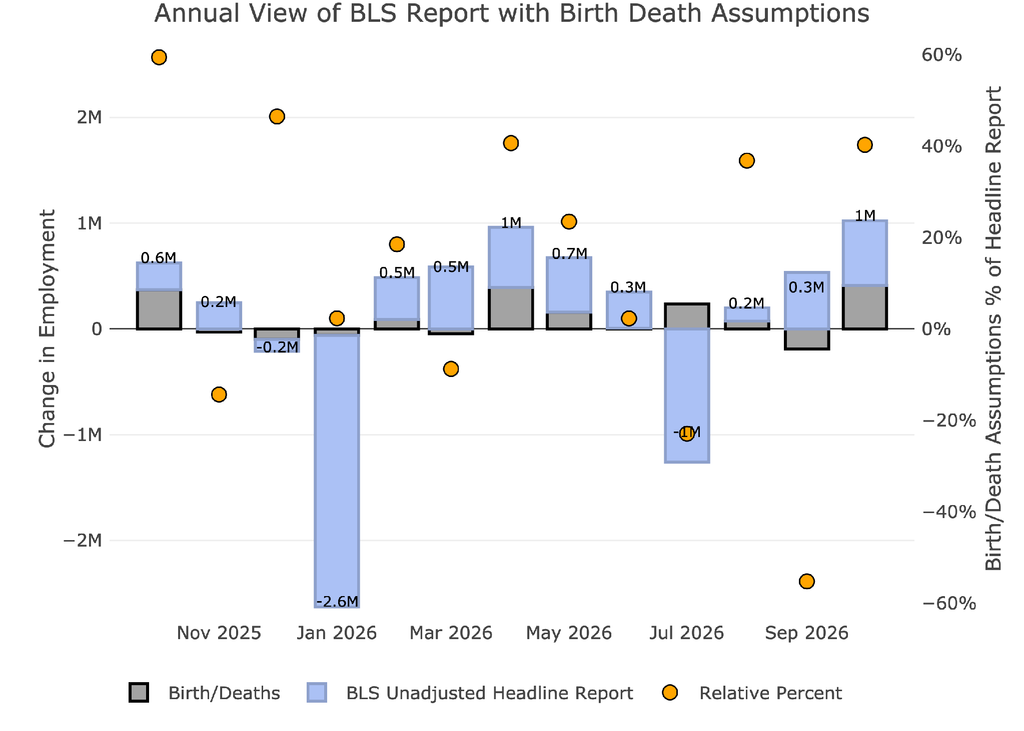
Figure: 3 Primary Unadjusted Report With Birth Death Assumptions – Monthly
Even with these generous assumptions, we are now in the second year where the assumed jobs are positive while the actual jobs are negative. That is after unadjusted job gains of 611k in October. This is a weak job market any way you slice it.
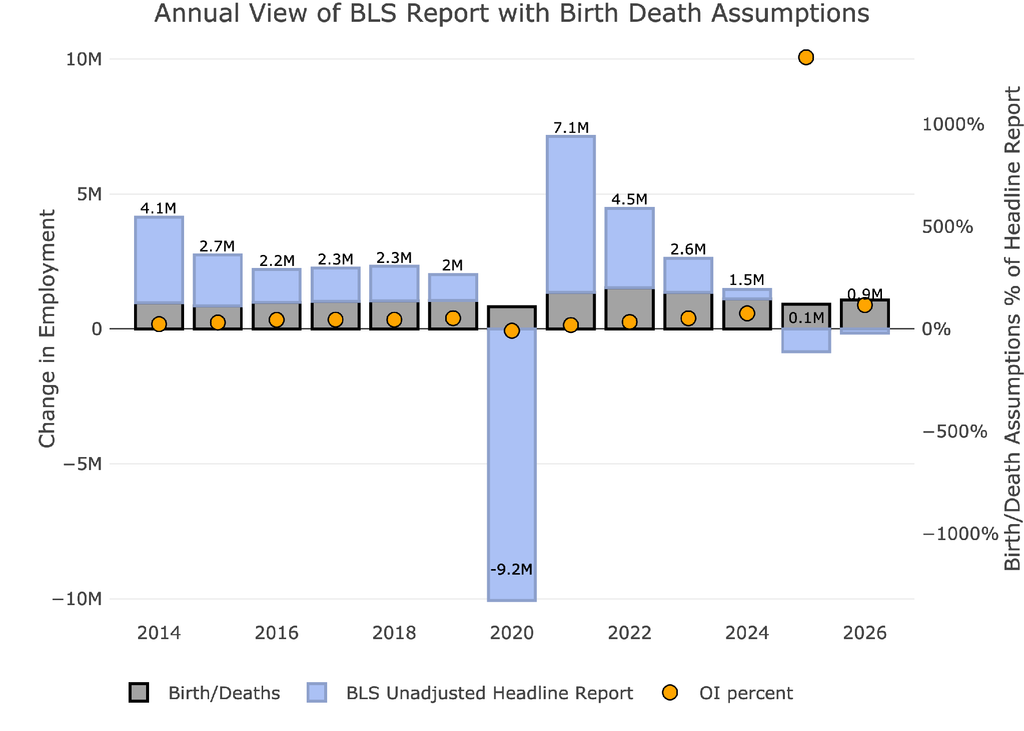
Figure: 4 Primary Unadjusted Report With Birth Death Assumptions – Monthly
Digging Into the Headline Report
Unfortunately, despite being highly unreliable, the Headline report is the best data we have for the more recent periods. Furthermore, this is the data the Fed uses to shape its policy. Even though Warsh is trying to be more discreet about how the Fed is going to work, and he has clearly stated that inflation is the primary focus, the weak labor market will definitely impact how the Fed makes its decisions.
The unemployment rate fell to 4.1%.
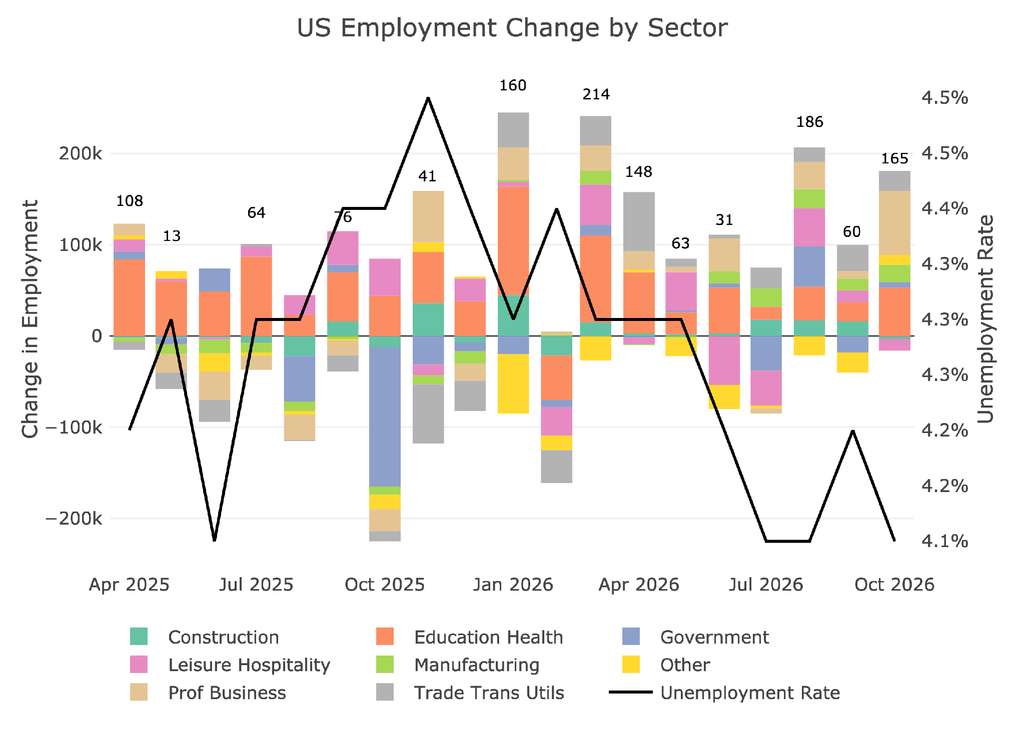
Figure: 5 Change by sector
Jobs by Category
Across the 8 job categories tracked in the headline report, 6 were above the 12-month trend. Only Construction and Leisure and Hospitality were below the 12-month trend.
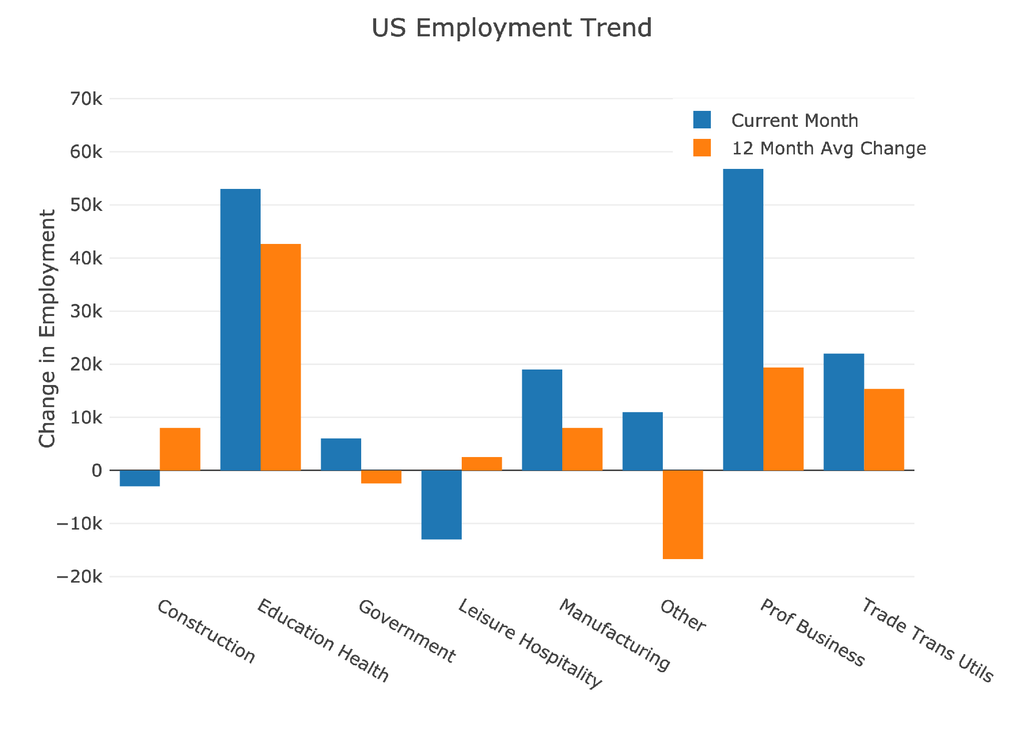
Figure: 6 Current vs TTM
The table below shows a detailed breakdown of the numbers.
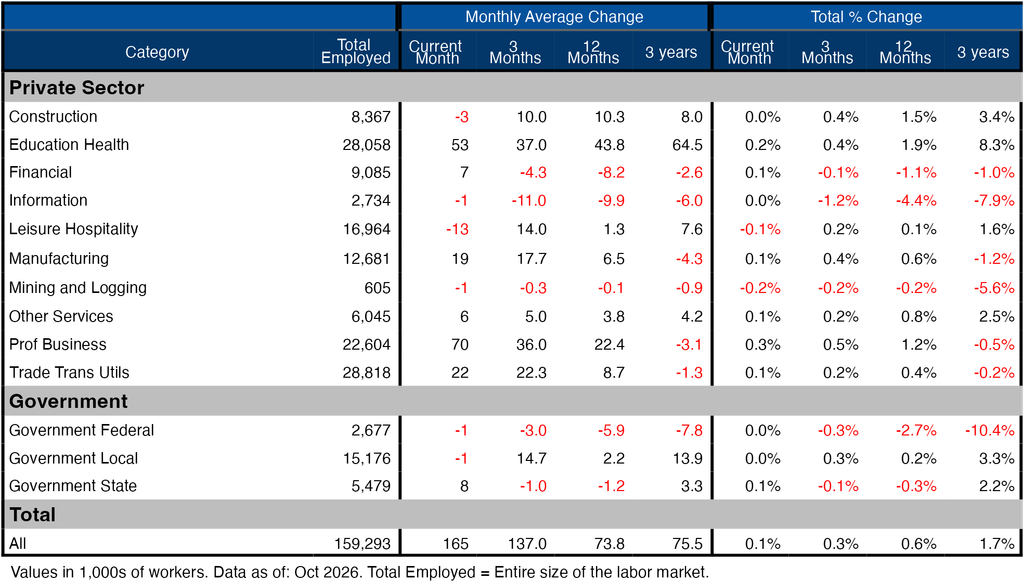
Figure: 7 Labor Market Detail
Revisions
This has been one of the biggest stories of the jobs report each month. The Headline Report has been constantly revised with big changes in the months following the release. The last three revised months (July through September) were all revised higher, which followed two months of downward revisions.
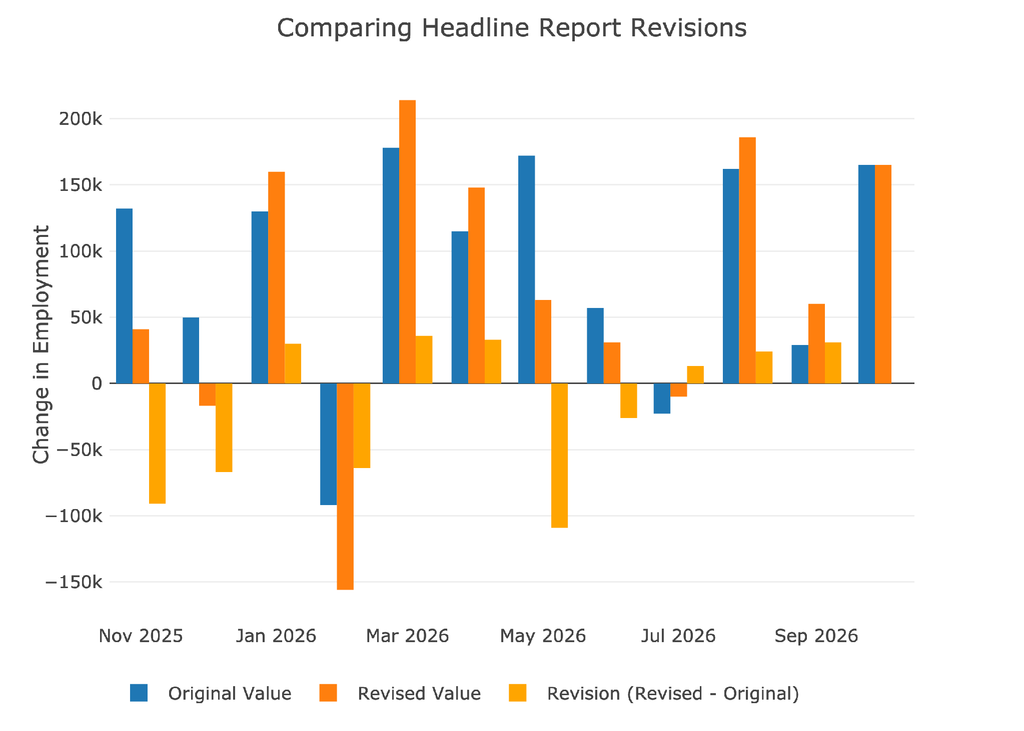
Figure: 8 Revisions
While the last three months show a positive revision on average, the last 12 months show an average revision of -13.1k per month, and the last three years have seen an average negative revision of 66.1k jobs per month!
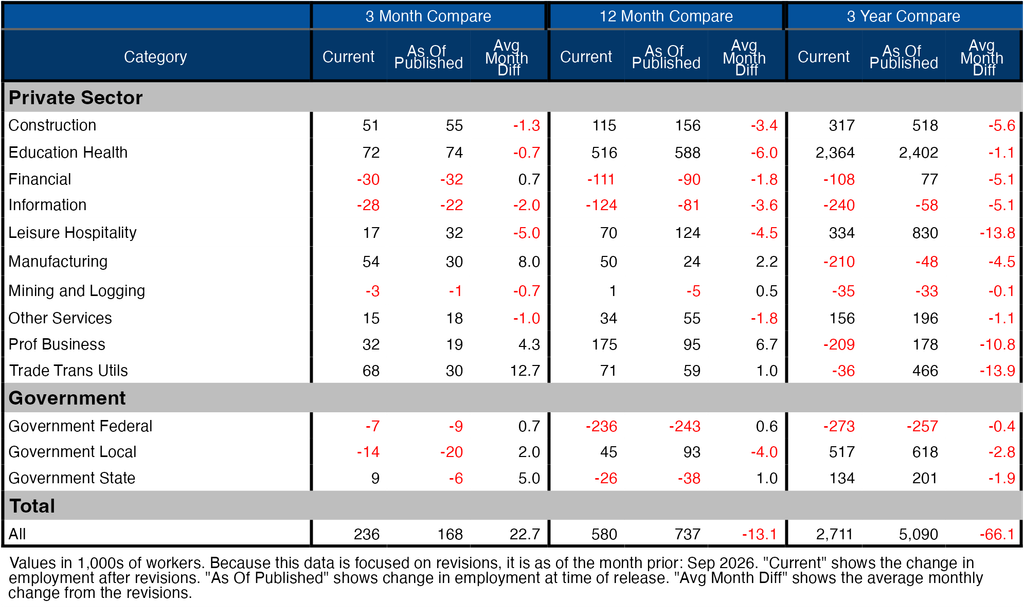
Figure: 9 Revisions
More Detail in the Household Survey
Another level of detail in the Household report shows full-time vs part-time job holders. The data shows full-time jobs growing for the last three months. This is a good sign in the Household Survey.
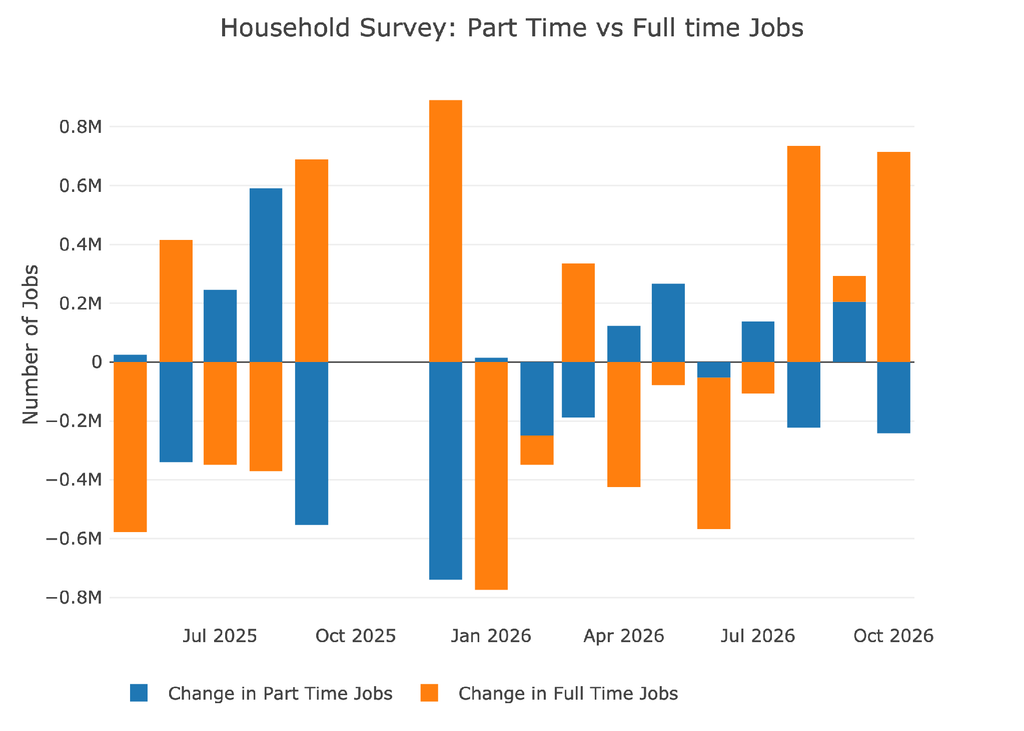
Figure: 10 Full-Time vs Part Time
Historical Perspective
The chart below shows data going back to 1955.
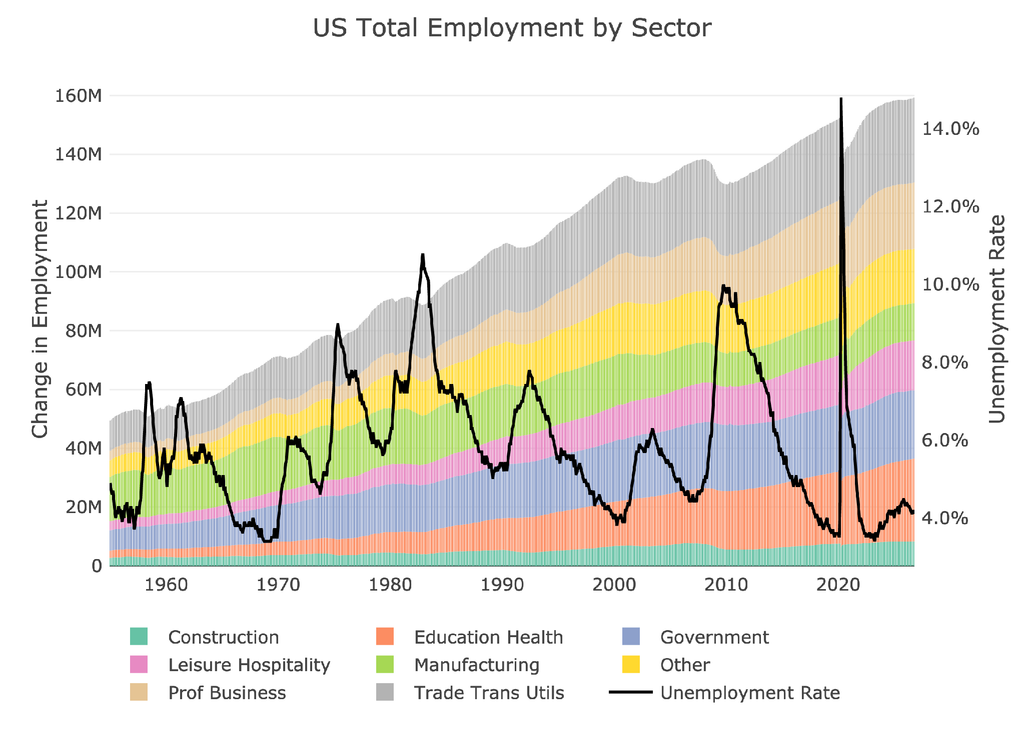
Figure: 11 Historical Labor Market
The labor force participation rate is still well below the highs before the Global Financial Crisis. This month showed it moving up to 61.9% from a recent low of 61.4%. It is good to see the improvement, but it is still well below where it should be.
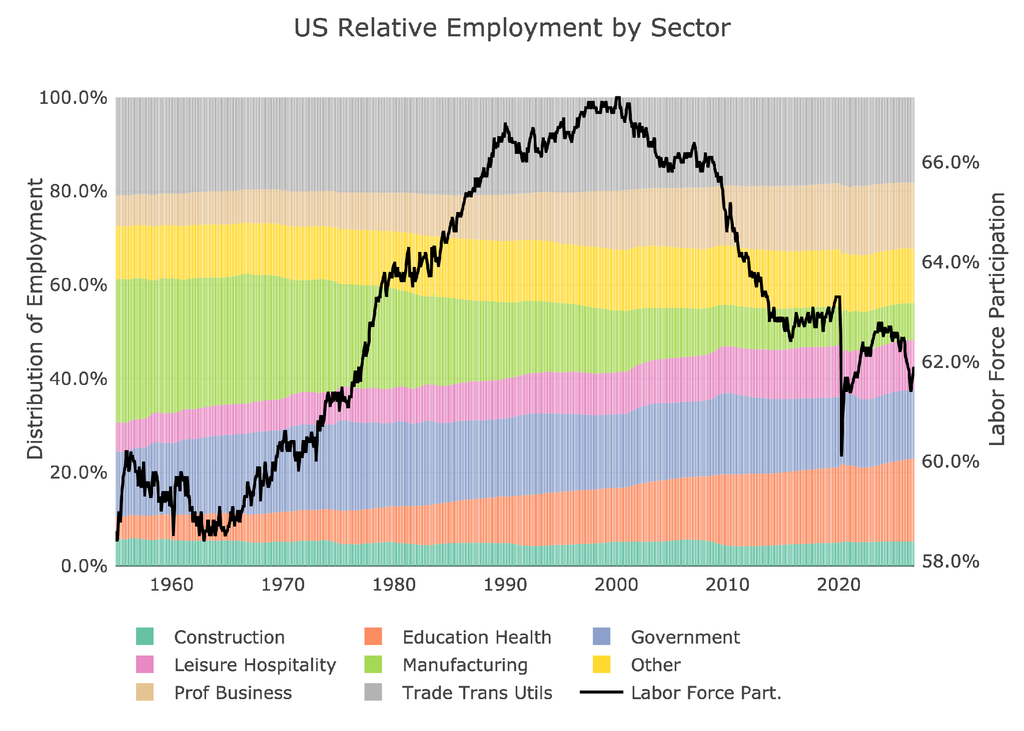
Figure: 12 Labor Market Distribution
Conclusion
The recent job report was modestly strong even though it is below the critical 200k per month. The strong Household Survey for the last three months cannot make up for the incredibly weak numbers earlier this year. Both reports show a weak job market with average monthly job gains this year of 86.1k for the Headline Report and -37.7k in the Household Survey.
This is not a good sign and may be showing we are in the late stages of the Economic cycle. The stock market has sold off. We may only be in the beginning stages. Everyone is expecting more hikes from the Fed, but if the labor market stays weak, those hikes could turn into cuts. Almost an exact opposite of what happened in 2026 when everyone was expecting cuts and got hikes. Stay tuned!

Receive SchiffGold’s key news stories in your inbox every week – click here – for a free subscription to his exclusive weekly email updates.
Interested in learning how to buy gold and buy silver?
Call 1-888-GOLD-160 and speak with a Precious Metals Specialist today!
 Live Chat
 Email:
 Phone: 1-888-465-3160