
Jobs: The Economy Only Added 28k jobs from Jan-Jun
Note: This includes the Jobs report for November that was released on December 16th and the QCEW Report released on Dec 19th
The analysis below covers the Employment picture released on the first Friday of every month. While most of the attention goes to the Headline Report, it can be helpful to look at the details, revisions, and other reports to get a better gauge of what is really going on.
Current Trends
The jobs report showed a modest increase of 64k jobs in November. This followed an estimated loss of 105k jobs in October. The Household Survey report was actually higher at 96k jobs for the month of November. There was no Household Survey for October.
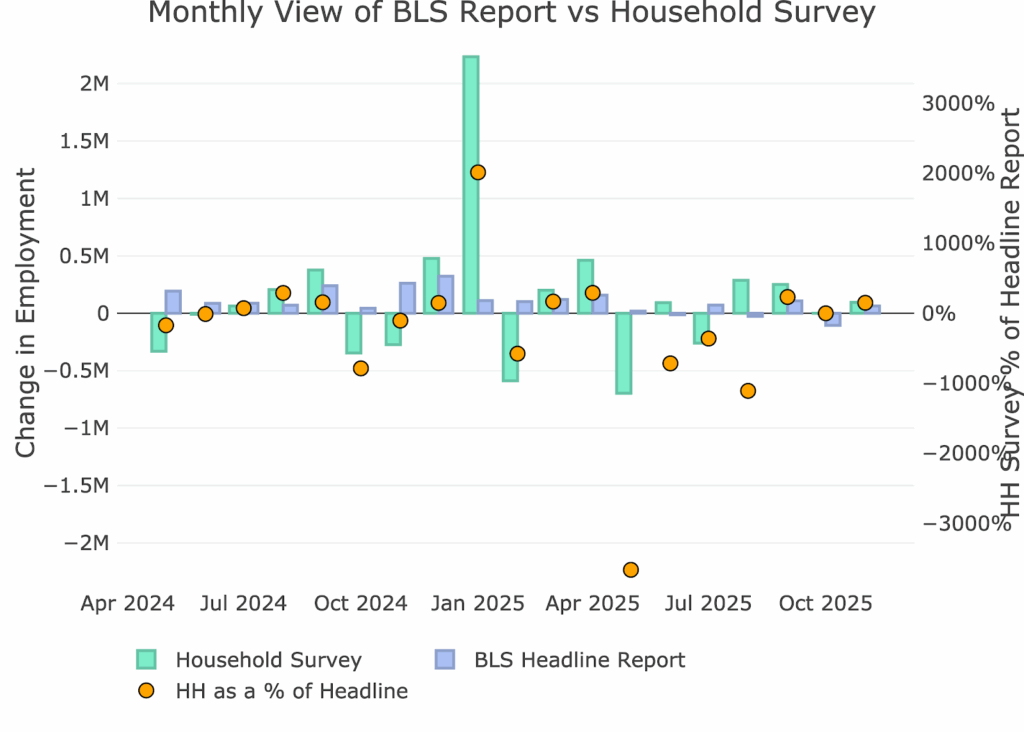
Figure: 1 Primary Report vs Household Survey – Monthly
For the year, the Household Survey is significantly higher due to the data anomaly in January. This was a one-time event, but the last two available household reports (Sept. and Nov.) were both higher than the Headline Report.
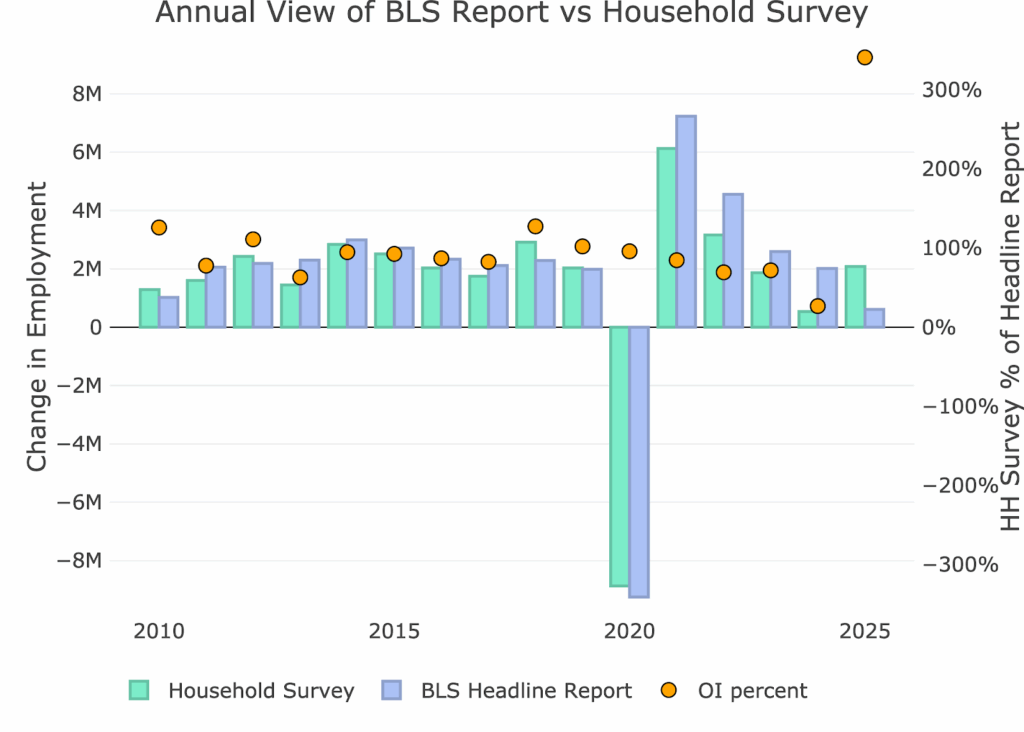
Figure: 2 Primary Report vs Household Survey – Annual
Switching to the headline report…
The BLS publishes the data behind their Birth/Death assumptions (formation of new business). In October, the BLS assumed 413k jobs into existence. In November there was a very modest -5k jobs assumed.
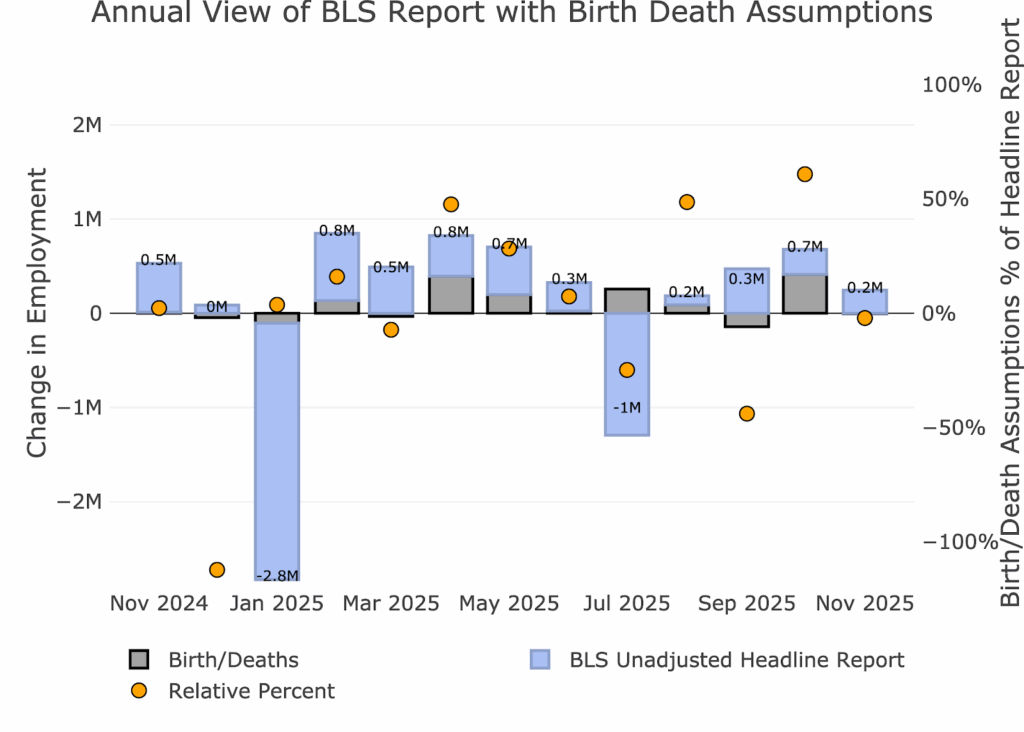
Figure: 3 Primary Unadjusted Report With Birth Death Assumptions – Monthly
For the year, the birth death assumption is a positive 1.2M against negative actuals of -496k. This means all positive growth YTD is directly tied to the birth/death assumptions.
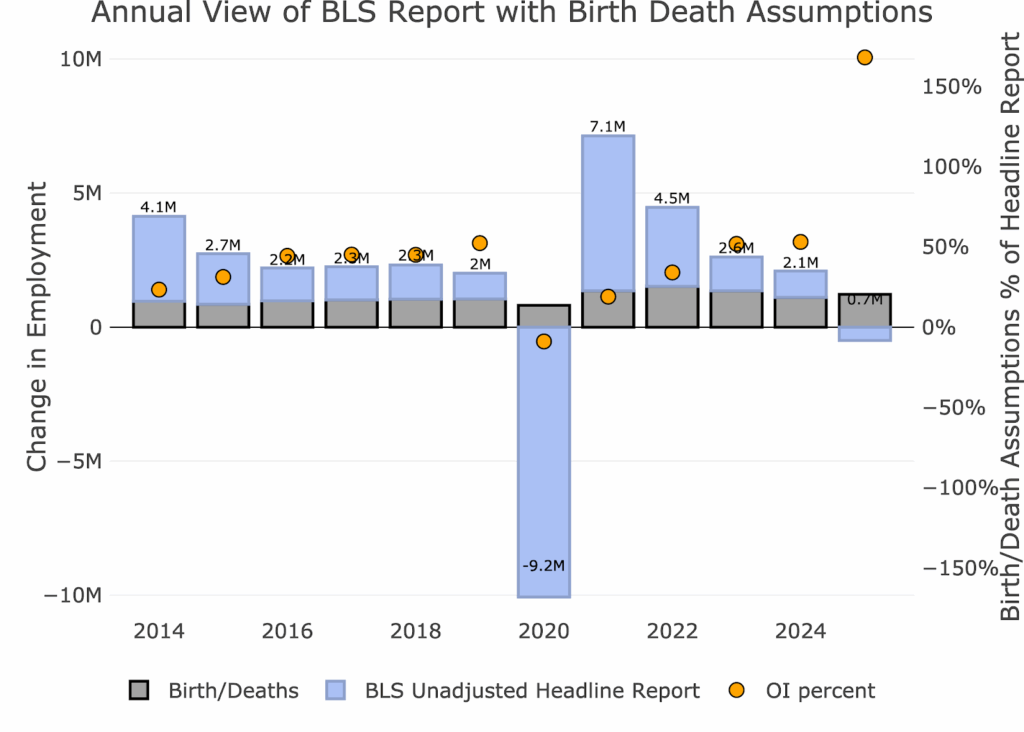
Figure: 4 Primary Unadjusted Report With Birth Death Assumptions – Monthly
The big report released today is the Quarterly Census of Employment and Wages (QCEW). According to the BLS, this is a far more accurate and rigorous report covering 95% of jobs available at a highly detailed level. Due to the rigor, the report is released quarterly on a several month lag.
The latest report is for Q2 2025. As shown, June was a massive underperformer while April and May overperformed.
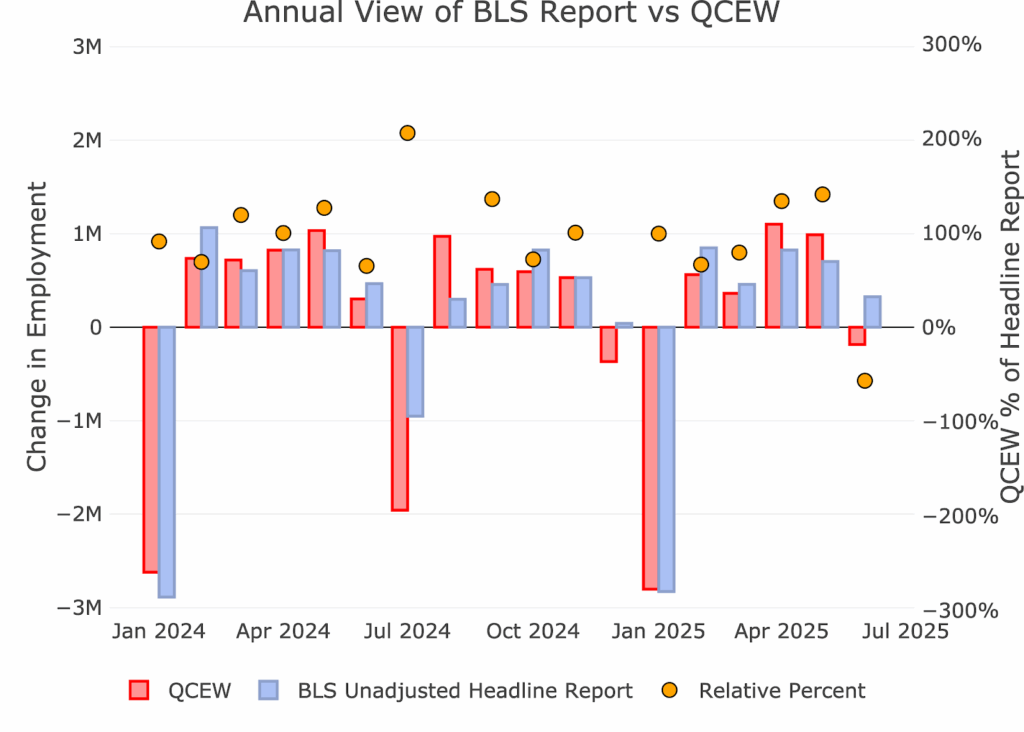
Figure: 5 Primary Report vs QCEW – Yearly
This QCEW data reveals a shocking discrepancy with the Headline Report. The chart below sums up everything you need to know about the Headline Report. Compared to the more accurate QCEW, the QCEW was 93% below the Headline Report! For context the next biggest miss was in 2024 where the QCEW was 34% below. That was a record at the time. This is a disaster on every level. The Headline Report, after revisions, is showing 333k jobs gained for the year, while the QCEW shows a mere 27k jobs. Those numbers are not even close.
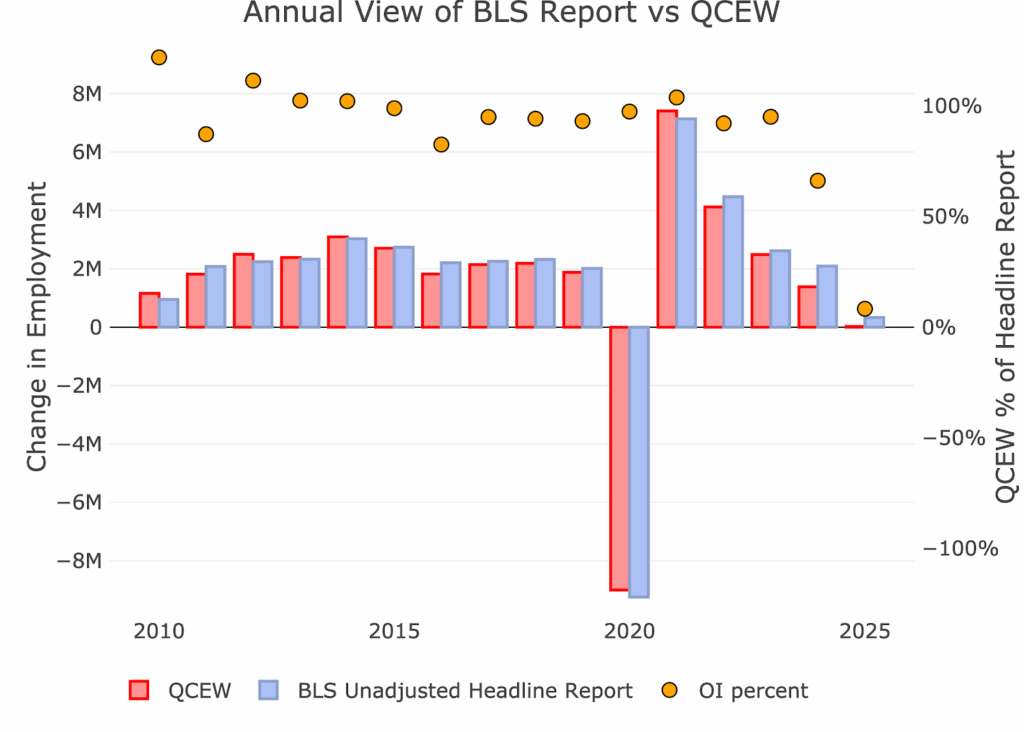
Figure: 6 Primary Report vs QCEW – Yearly
Digging Into the Headline Report
Unfortunately, despite being highly unreliable, the Headline report is the best data we have for the more recent periods. Furthermore, this is the data the Fed uses to shape its policy. The 64k jobs number was accompanied by a rise in the unemployment rate to 4.6% (the highest since 2021).
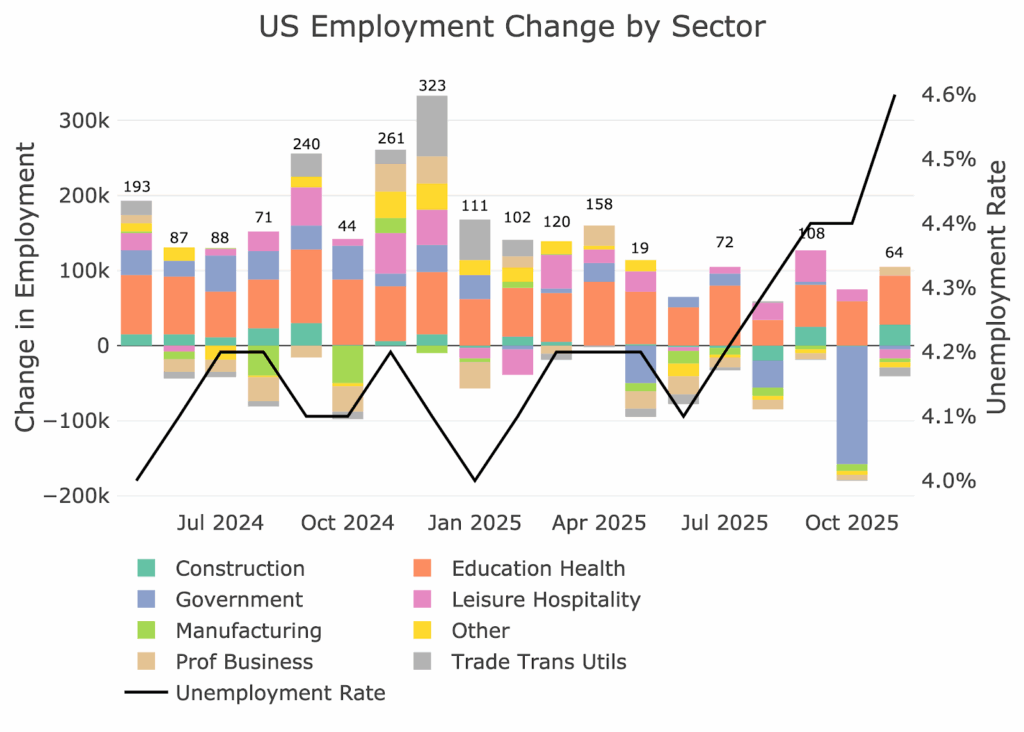
Figure: 7 Change by sector
Jobs by Category
When looking at the last 12-month trend, 5 of the categories were actually above trend with 3 below.
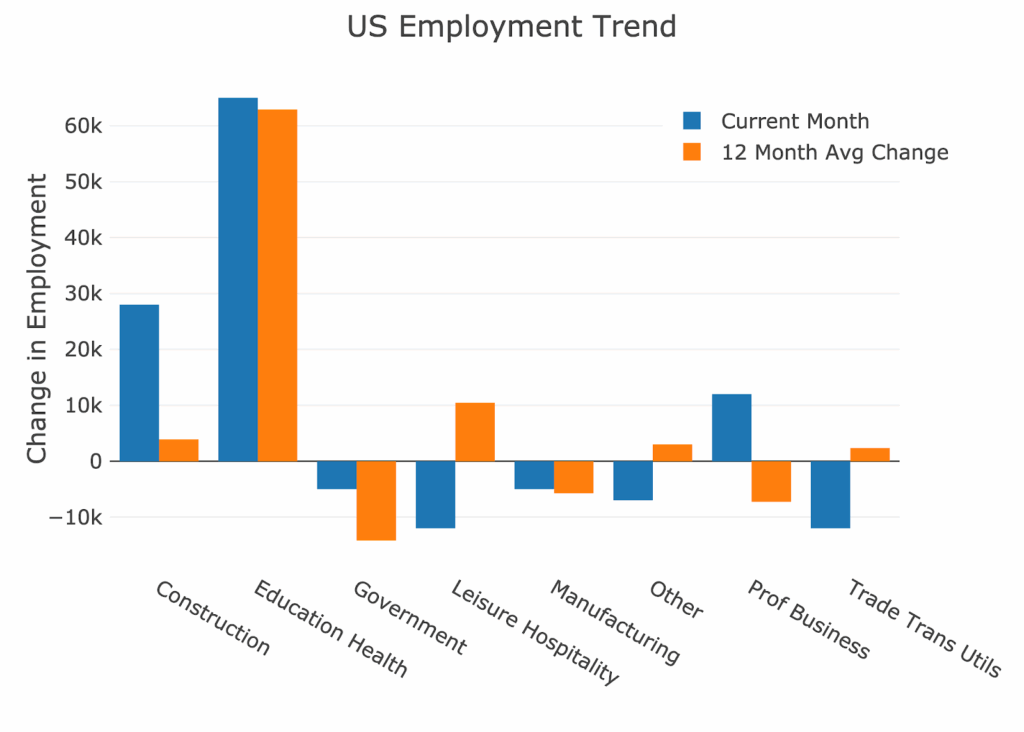
Figure: 8 Current vs TTM
The table below shows a detailed breakdown of the numbers.
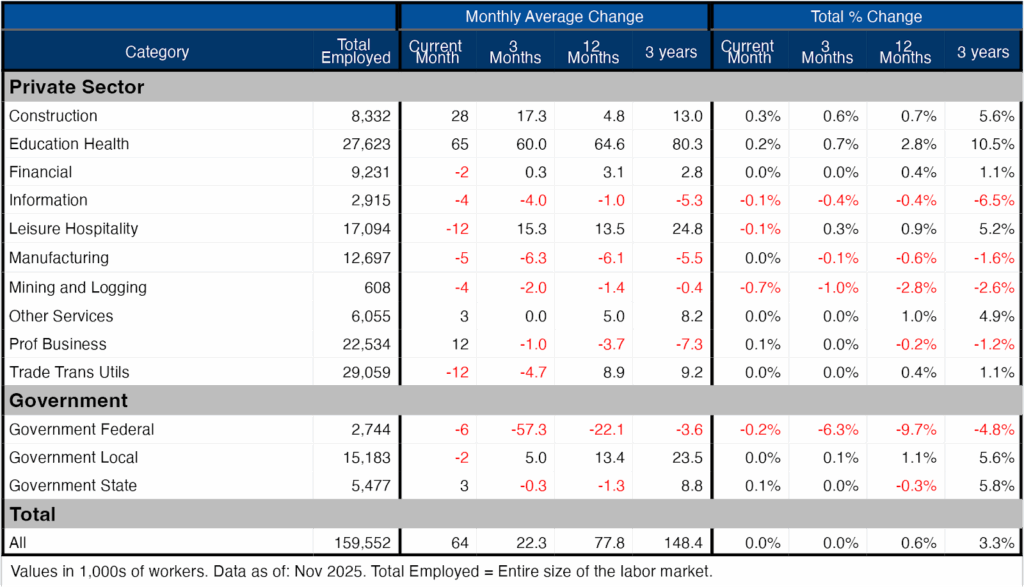
Figure: 9 Labor Market Detail
Revisions
This is the biggest component of the jobs report. Every single month this year has seen negative revisions. May and June both saw +100k jobs come off the total with June actually turning negative. Both June and August are now showing negative job months where they had previously been positive. September, the most recently revised month, lost 21k jobs in the revision.
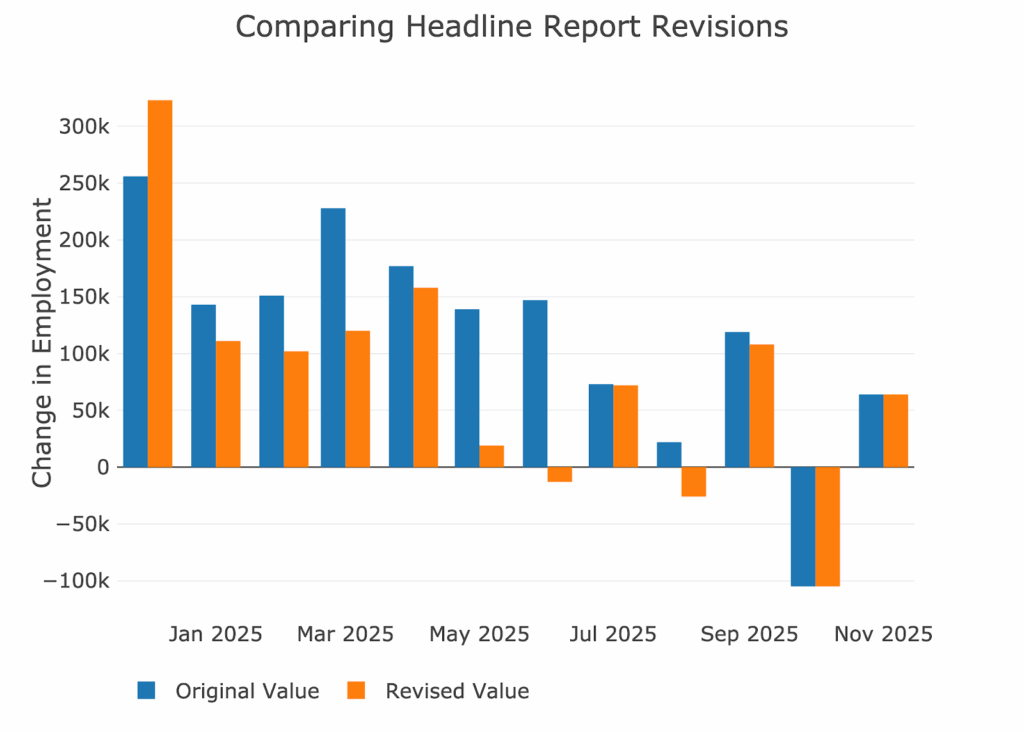
Figure: 10 Revisions
Over the last twelve months, jobs have been revised down by about 51k per month and revised lower by 76k over the last three months!
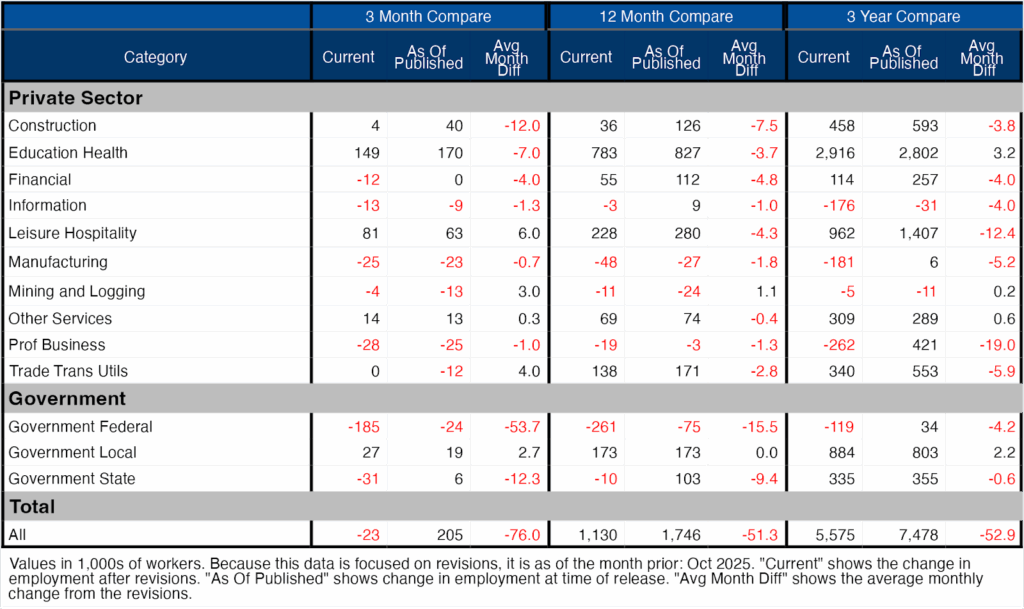
Figure: 11 Revisions
More Detail in the Household Survey
Another level of detail in the Household report shows full-time vs part-time job holders. This month shows that full-time jobs were gained while part-time were lost
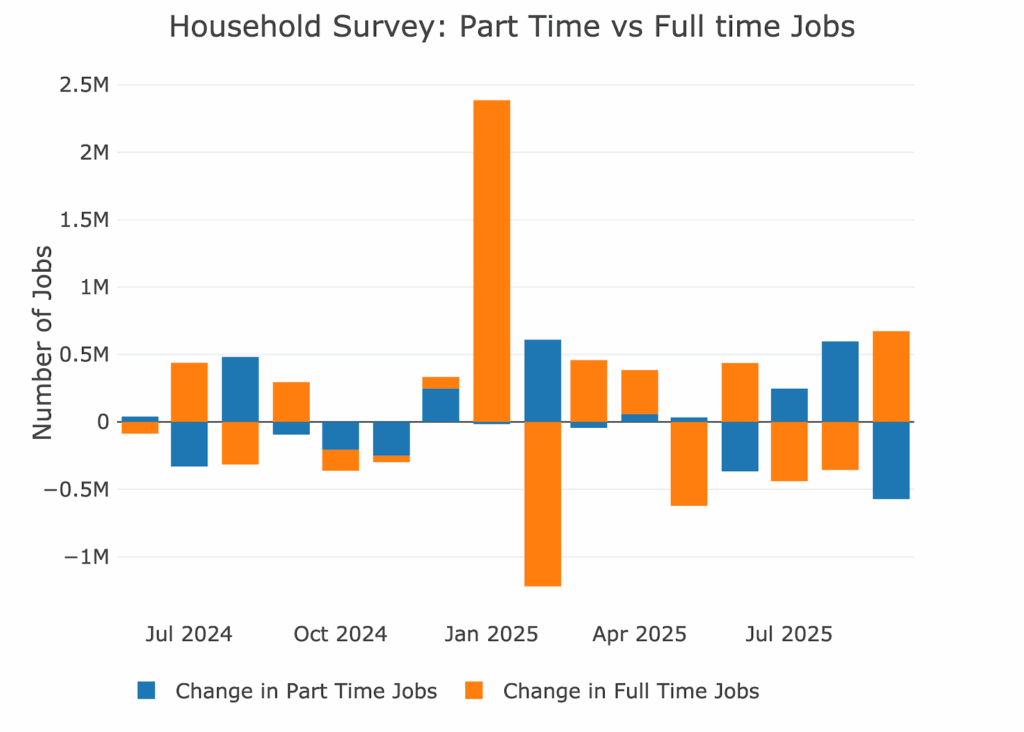
Figure: 13 Full Time vs Part Time
Historical Perspective
The chart below shows data going back to 1955.
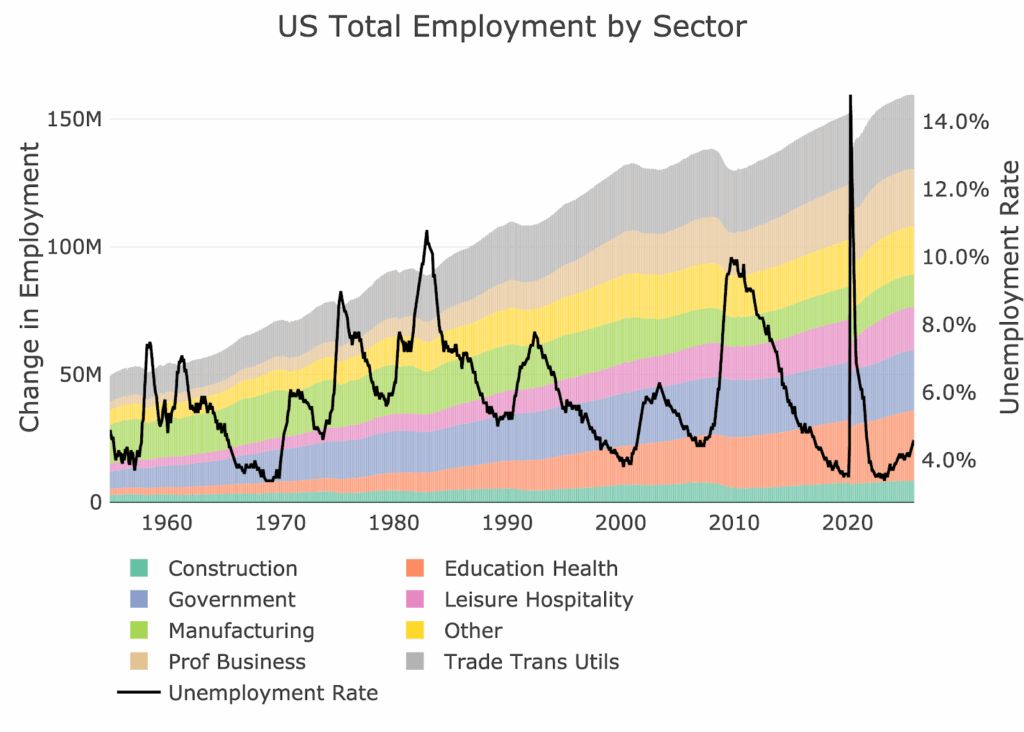
Figure: 14 Historical Labor Market
The labor force participation rate is still well below the highs before the Global Financial Crisis. This month it increased slightly to 62.4%.
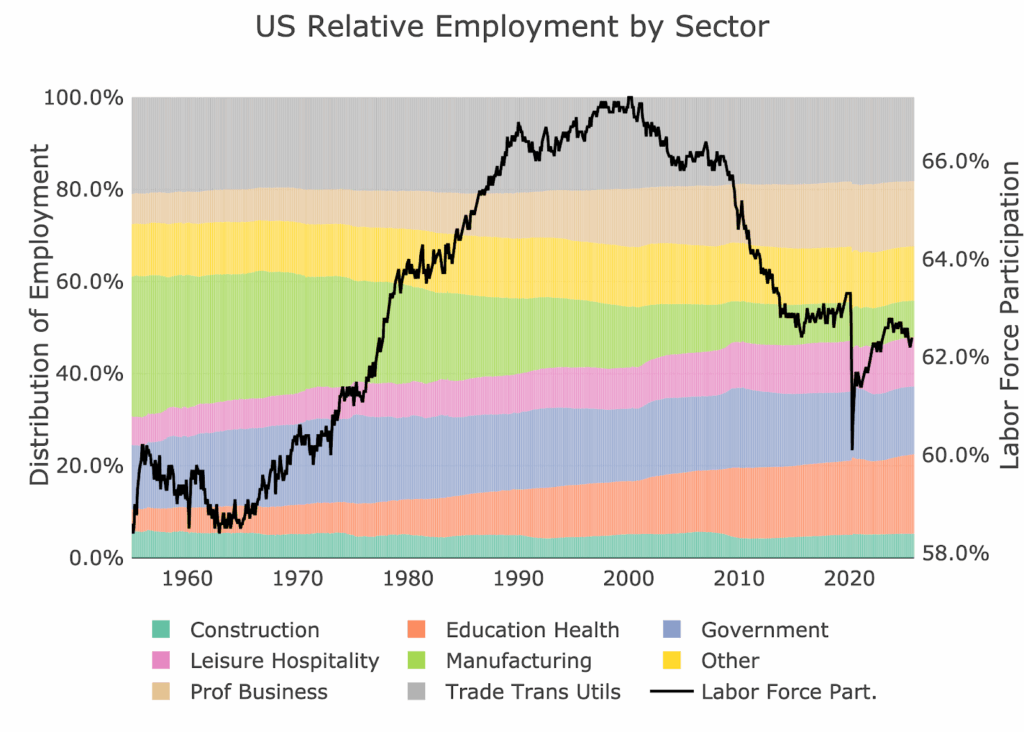
Figure: 15 Labor Market Distribution
Conclusion
The jobs revisions have gotten so bad that even Jerome Powell has said something about it. The QCEW report released today is even more evidence that the Headline Report cannot be trusted. The bottom line though is that the economy actually only added 28k jobs in the first 6 months. This is a huge red flag for anyone looking for positives in the labor market. The Fed just restarted QE last week, don’t expect it to end anytime soon.
