
US Government Borrows $800B in 3 months
Current Trends
The US government has borrowed over $800B in the last three months. This is a gargantuan sum of money that annualizes to ~$3.2T. This is an astonishing amount of money given the economy is not technically in recession. If there is an even a minor bump in the economy, the government spending will have to increase which is going to drive this number even higher.
Note: Non-Marketable consists almost entirely of debt the government owes to itself (e.g., debt owed to Social Security or public retirement)
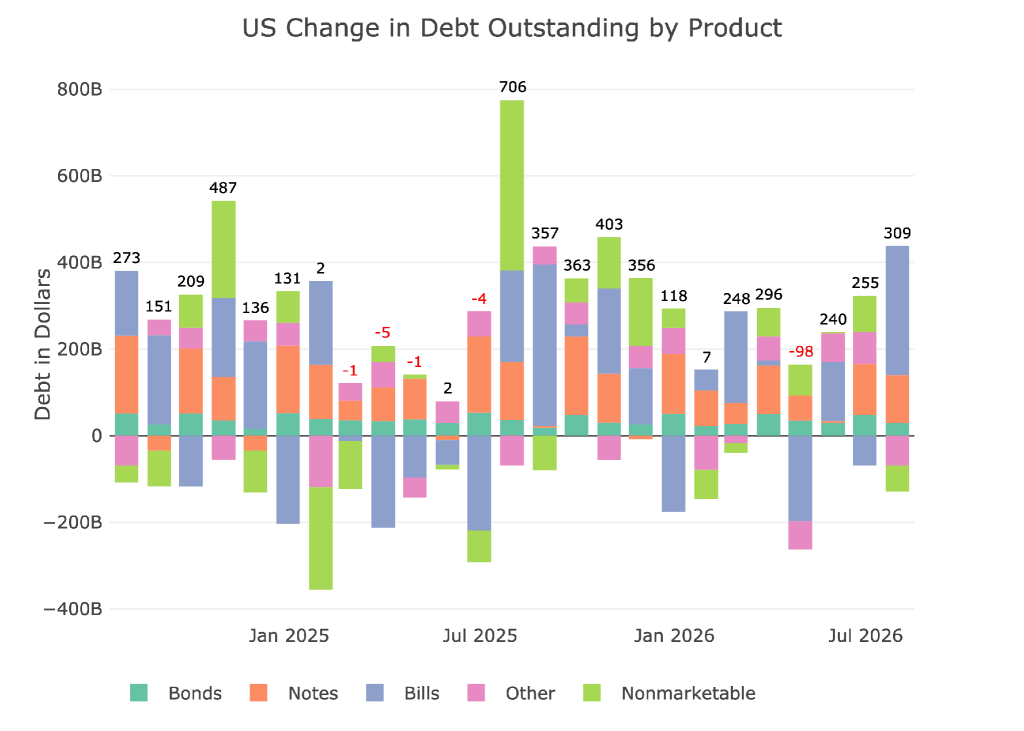
Figure: 1 Month Over Month change in Debt
Due to the massive debt issuance, the treasury is relying Bills (short-term debt) more and more. The appetite for long term debt is simply not big enough. You can see how the trend has changed over time. In the early 2010s the bulk of debt issuance was in Notes (2-10 years). Even in 2025, Notes made up a substantial portion. However, in 2026 you can see that Bills are making up an ever-larger portion of the total debt issuance.
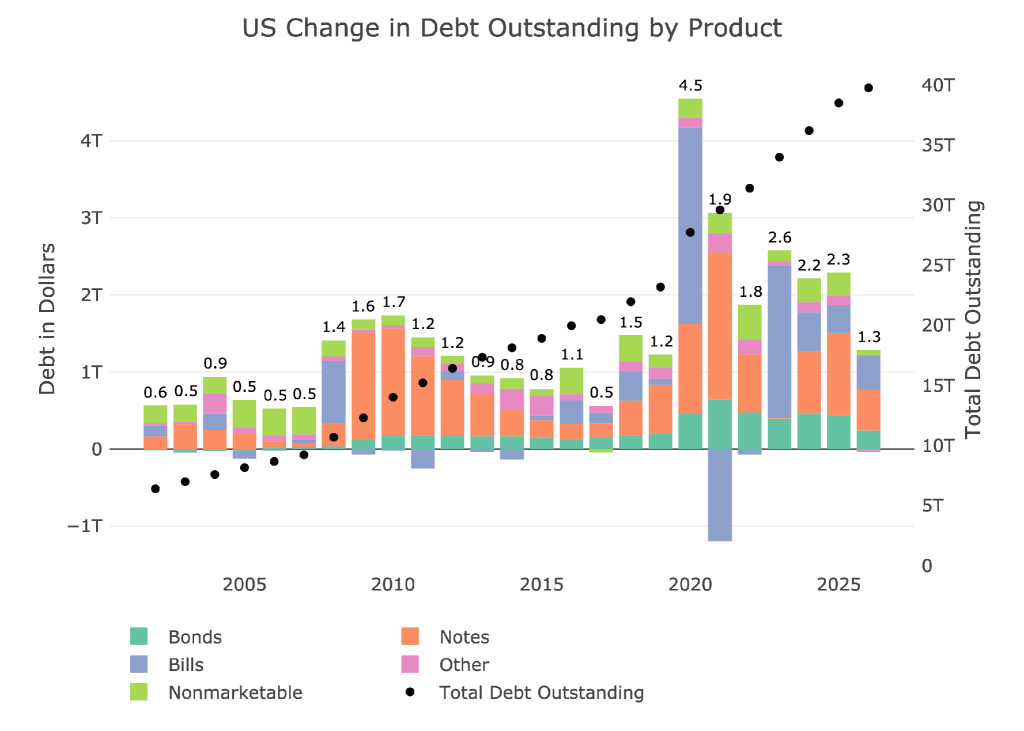
Figure: 2 Year Over Year change in Debt
One good piece of news is that the Treasury has strengthened their cash position to $1T.
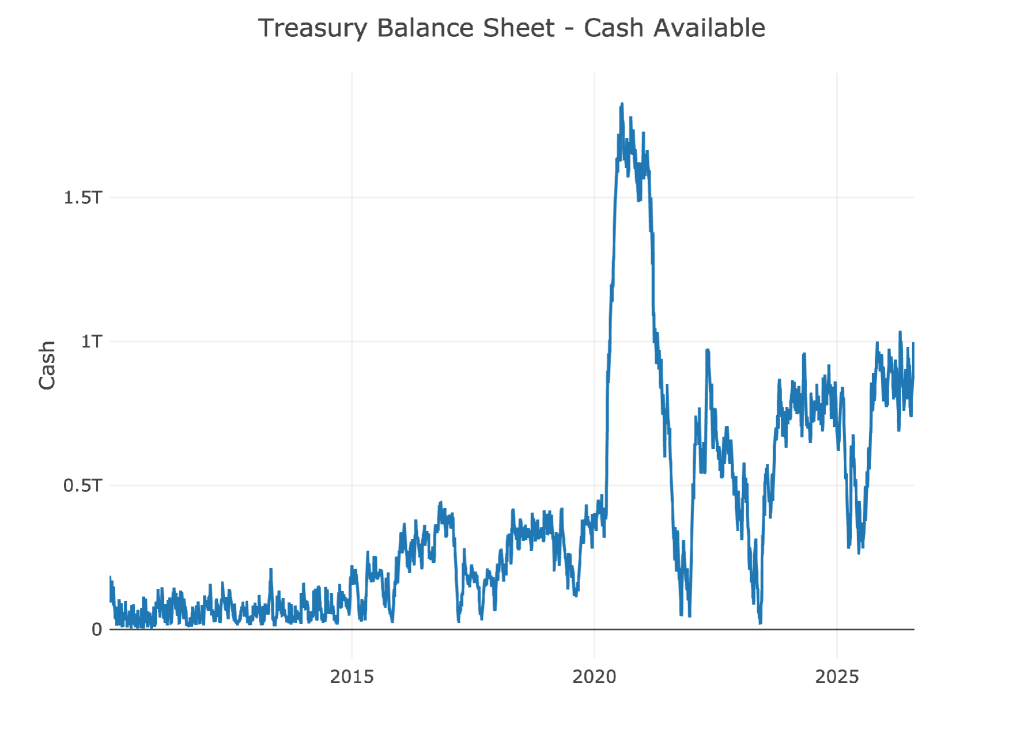
Figure: 3 Treasury Cash Balance
The chart below shows both the maturity of the debt and average interest rate. The blended interest rate has stabilized around 3.1%. More concerning is the average maturity of the debt is now around 5.9 years. Lower average maturity means the government will have to roll over more debt each year. It increases the risk if the appetite for US debt starts to slow or holders turn into net sellers.
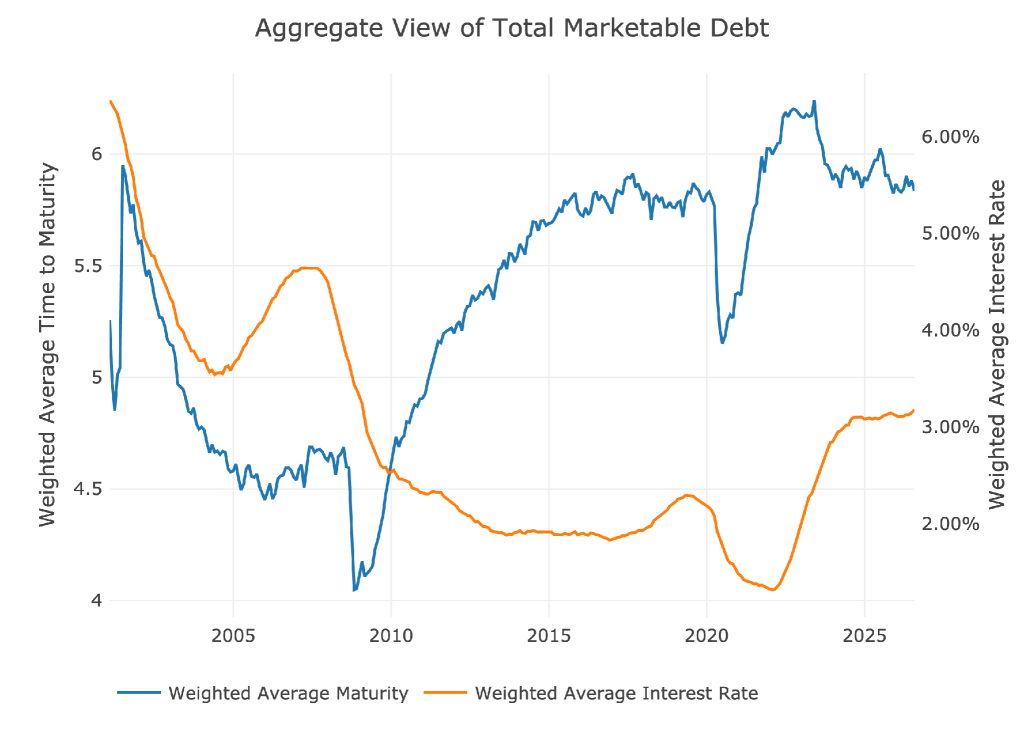
Figure: 4 Weighted Averages
The true danger facing the government is still in the massive interest currently being paid on the debt. Interest now sits above $1T a year! As shown in the chart, about half of this is concentrated in Notes, which is debt maturing between 2 and 10 years. You can also see the massive increase in interest tied to notes. This is the primary reason the Fed cannot raise rates. If the Fed raises short-term rates, it only drives interest expenses up. It is already unsustainable.
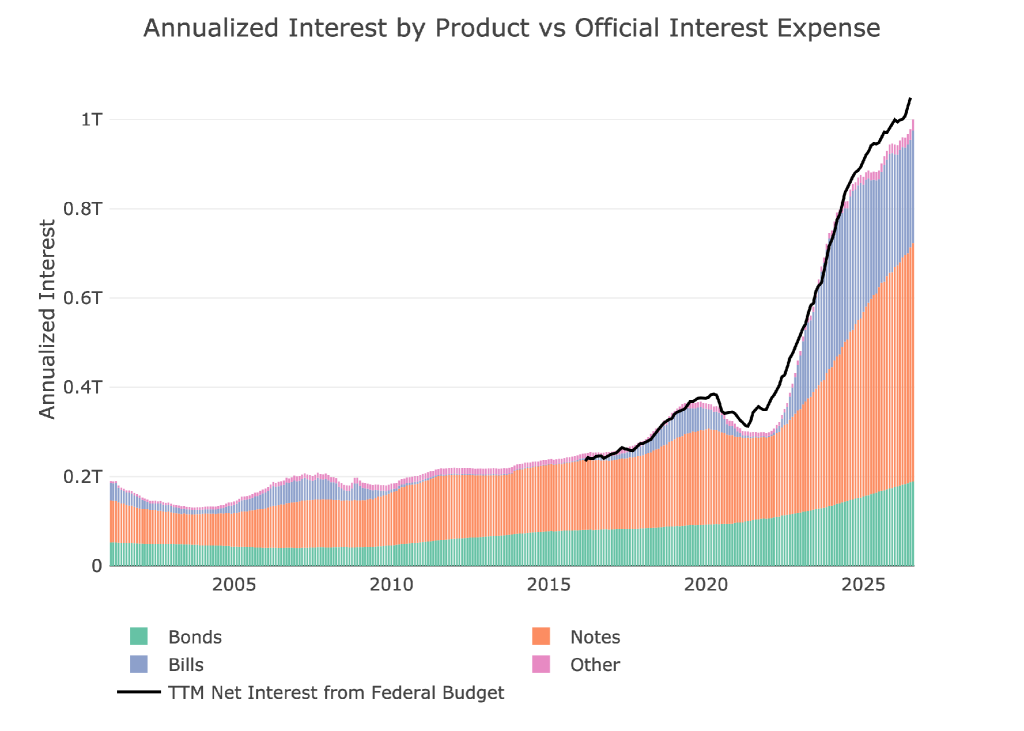
Figure: 5 Net Interest Expense
A lot is unknown about how Warsh will manage interest rates, but assuming the Fed simply stays put, combined with the rolling maturity of the debt, we can forecast out the cost of the debt going forward. Again, the Treasury left “debt affordability” in the rearview mirror in 2021. The Treasury is now absolutely hemorrhaging cash on debt service costs, set to rise over $1.2T in 2027.
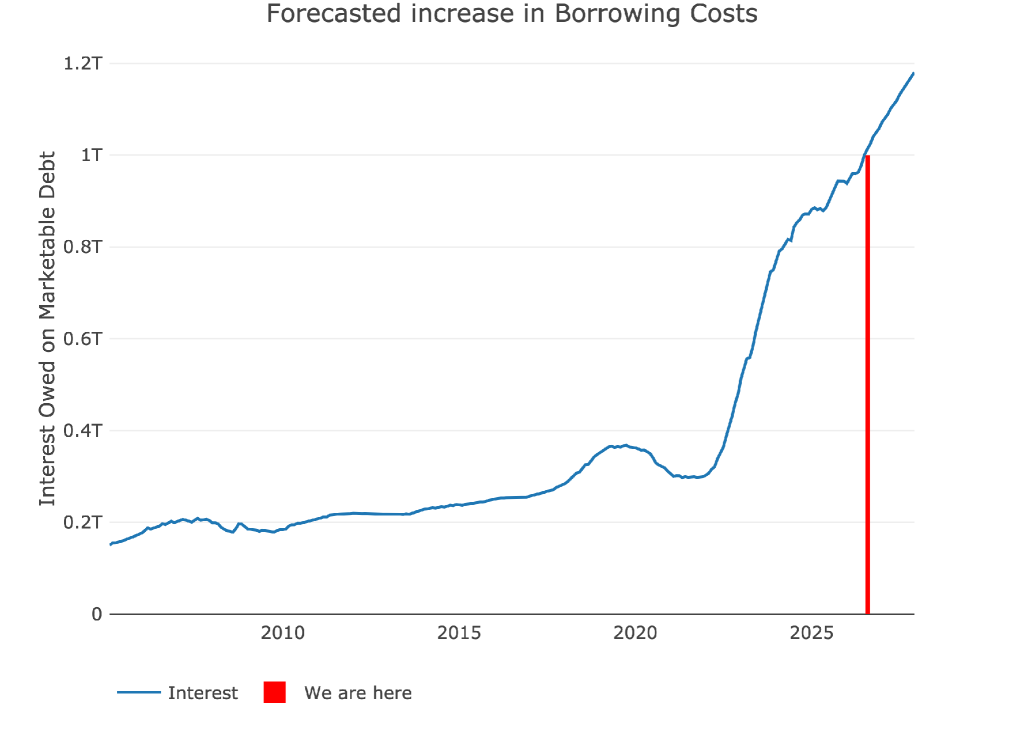
Figure: 6 Projected Net Interest Expense
Speaking of debt issuance and rollover, the chart below shows the forecasted debt maturing for 2-10 year maturities. Debt rolling over will be $600B higher in 2026 than it was in 2025. There will be another $500B increase in rollover in 2027. This will bring the total to $3.4T! This is all just existing debt, nothing new. That means in 2027 total note issuance could exceed $5T which greatly increases our interest rate risk.
Note “Net Change in Debt” is the difference between Debt Issued and Debt Matured. This means when positive it is part of Debt Issued and when negative it represents Debt Matured
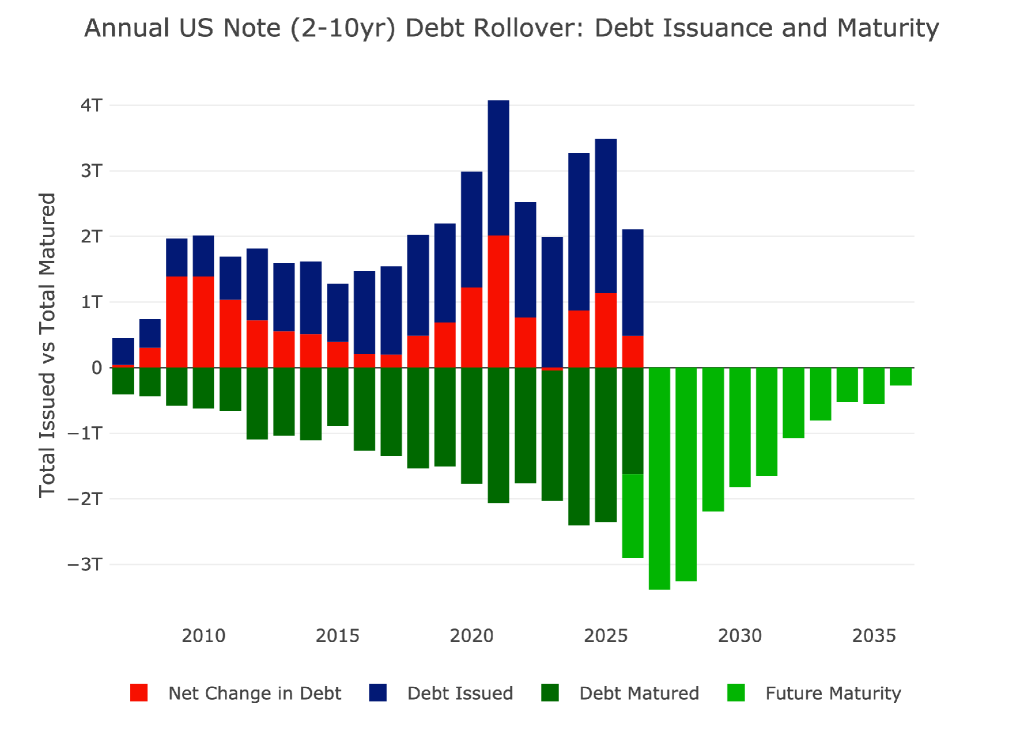
Figure: 7 Treasury Note Rollover
Yield Curve
The yield curve has gone back to positive sloping between the 2 and 10 year. The Treasury was borrowing short-term the entire time it was inverted which seems like an odd decision. The current thinking is that Warsh may have to actually raise rates, but he is clearly hesitant to do so.
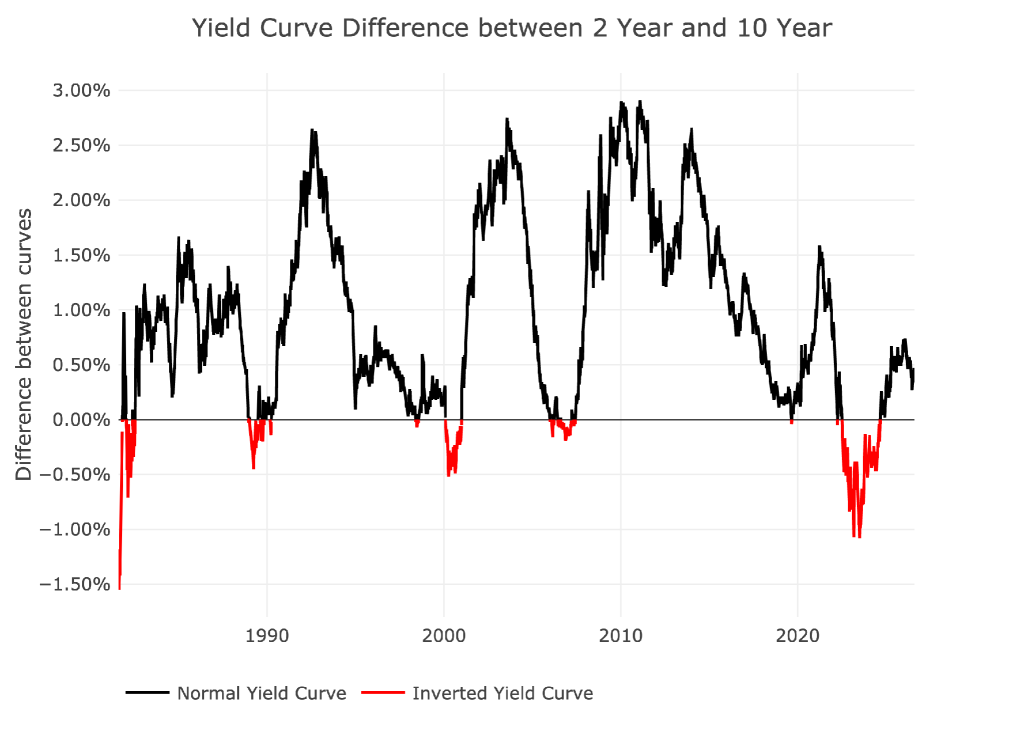
Figure: 8 Tracking Yield Curve Inversion
Historical Perspective
The chart and table below show how the debt and interest has changed over time.
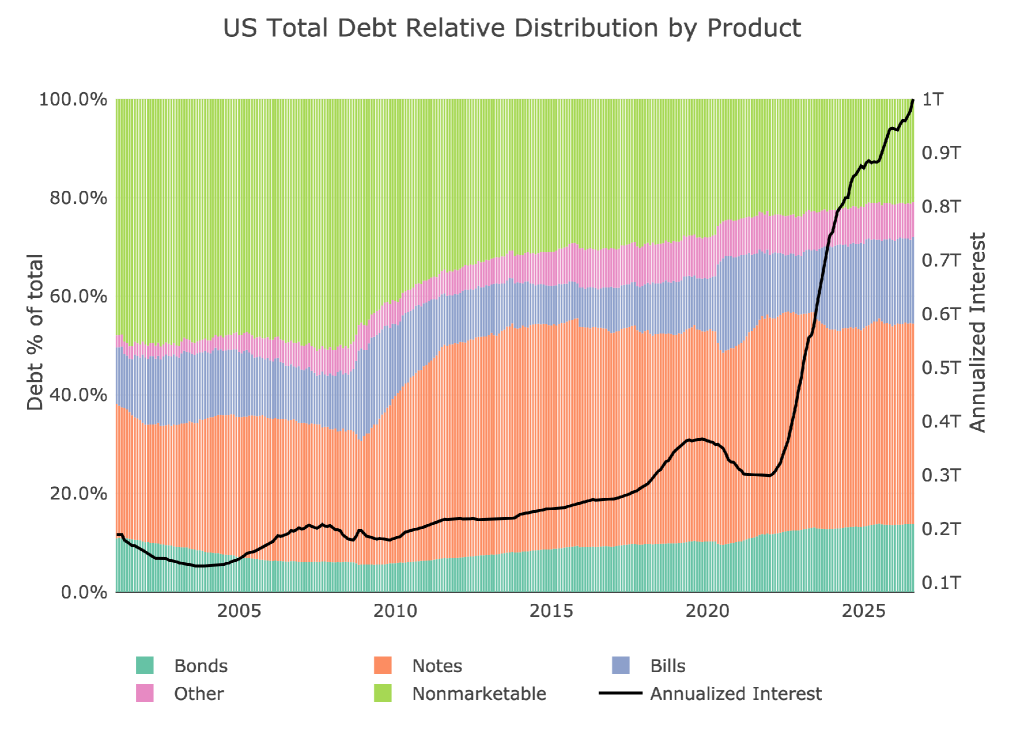
Figure: 9 Total Debt Outstanding
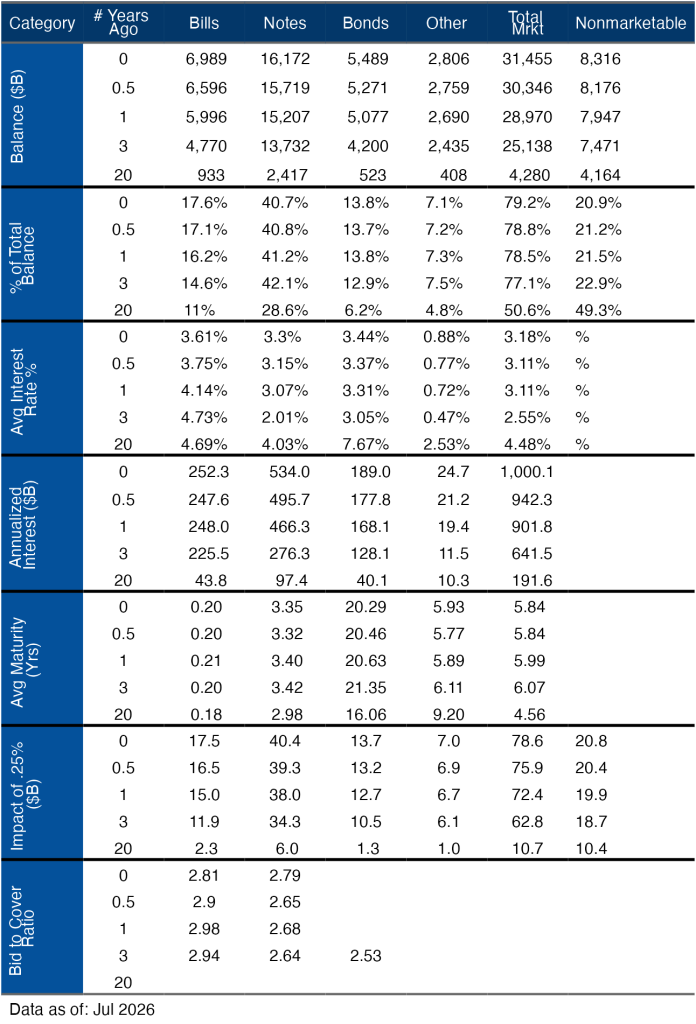
Figure: 10 Debt Details over 20 years
Wrapping Up
The US fiscal situation is completely out of control. With the government set to exceed $40T in total debt within a few months, one has to ask how and when does this all end. $1T in annual interest payments is a massive thorn in the side of the US budget situation. Adding $3T a year in new debt ($90B in interest per year) means that in ~3 years the US will cross $50T with an extra $600B per year in interest.
Keep in mind that may be a conservative estimate. It’s more likely that debt could increase even faster which only accelerates the downward spiral. There is no way out of this situation except through inflation. The government has no appetite to cut spending. Warsh can talk tough, but the math indicates he has no choice but to keep the printing presses rolling, which means inflation will only move higher.

 Live Chat
 Email:
  Phone: 1-888-465-3160