
Money Supply Grows at a 6% Annualized Pace in September
Money Supply is a very important indicator. It helps show how tight or loose current monetary conditions are regardless of what the Fed is doing with interest rates. Even if the Fed is tight, if Money Supply is increasing, it has an inflationary effect.
One key metric shown below is the “Wenzel” 13-week annualized money supply figure. It was made popular by the late Robert Wenzel who tracked the metric weekly as an indicator for where the economy might be headed. In 2020, the Fed started reporting the data monthly instead of weekly. It should also be noted that Money Supply data can be heavily revised in future months.
Recent Trends
Seasonally Adjusted Money Supply has been growing on a consistent monthly basis since November 2023. The latest month (September) showed growth of $113B which is another large month under new Fed chair Warsh. Since Warsh took the mantle as Fed chair, nearly every monthly number has been larger than $100B. He can say that inflation is his greatest concern, but his actions say otherwise.
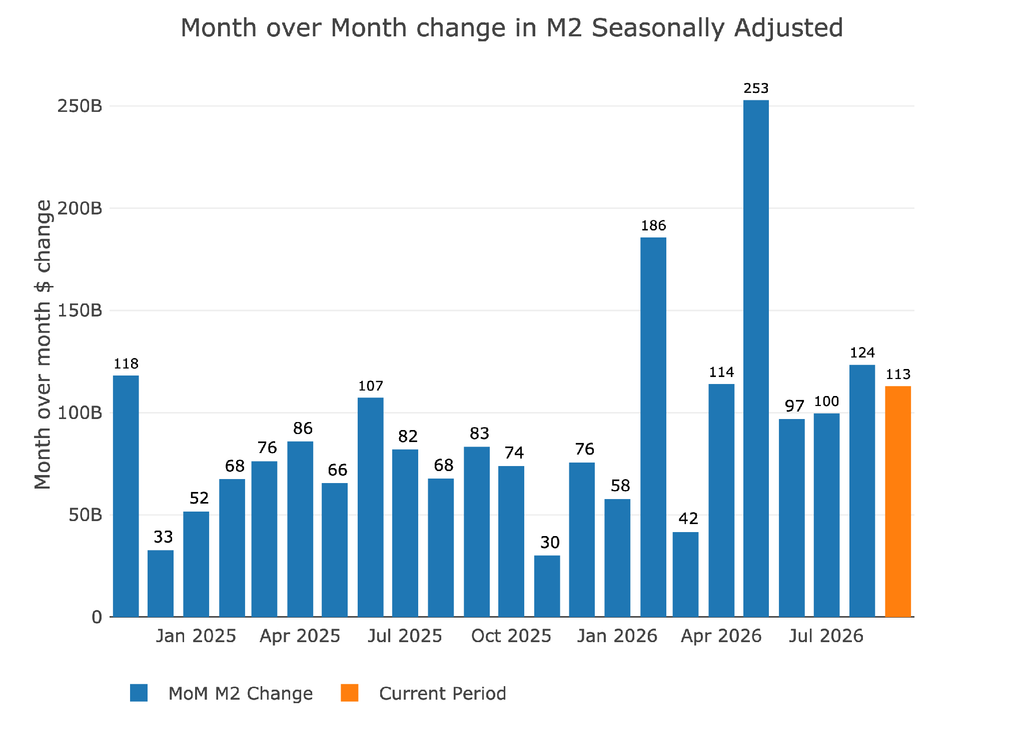
Figure: 1 MoM M2 Change (Seasonally Adjusted)
The increase in September was 6% annualized, which is well above the three-year average of 4.1%. It is slightly above the one year average of 5.7%, but below the 6-month average of 7.2%.

Figure: 2 M2 Growth Rates
September is typically around 4.5%, so from that perspective, this year was well above average.
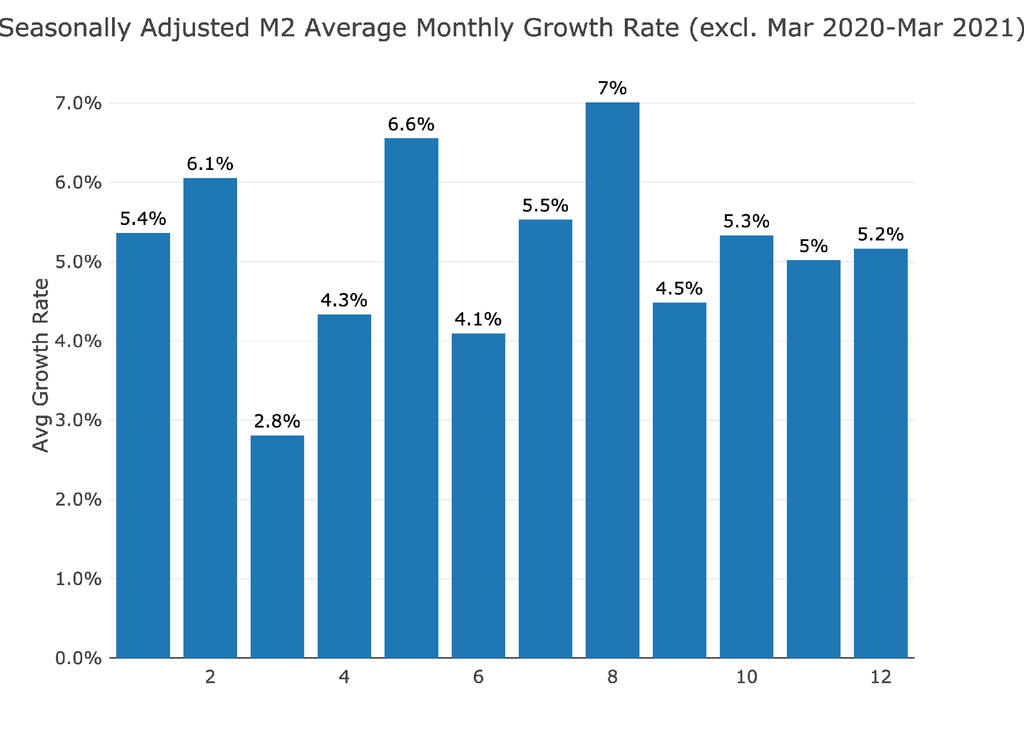
Figure: 3 Average Monthly Growth Rates
Non-seasonally adjusted shows that September was a modest increase with October so far showing a massive increase of $214B.
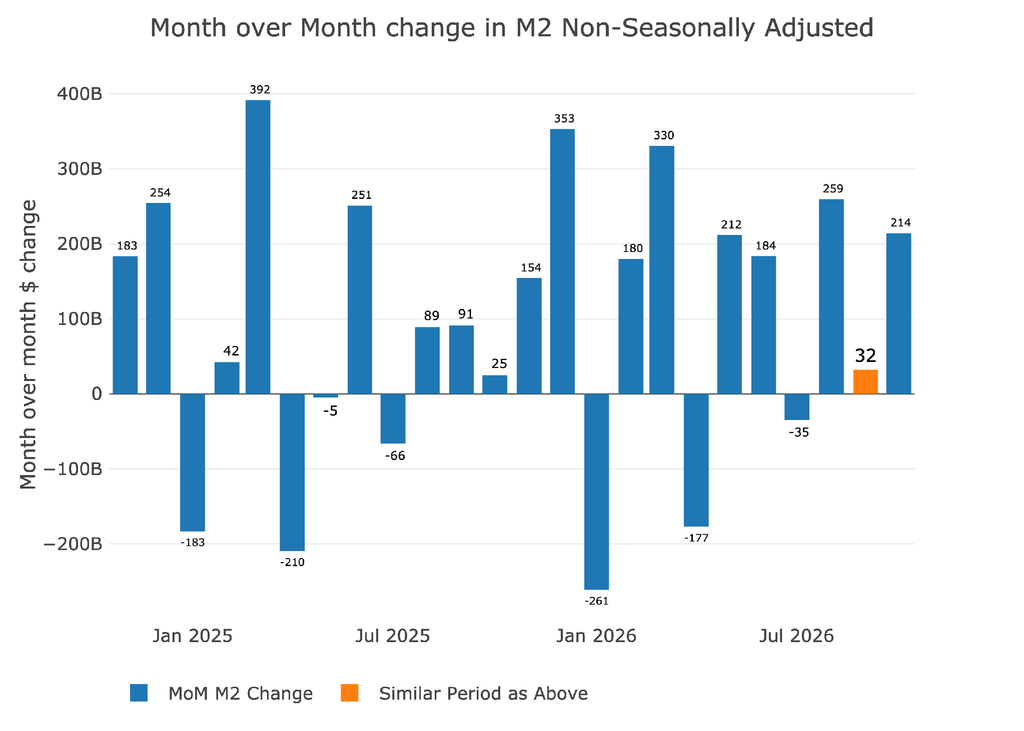
Figure: 4 MoM M2 Change (Non-Seasonally Adjusted)
The weekly data shows the latest period as October 5th which means the month is far from complete. Still, it was the largest weekly increase since April of this year.
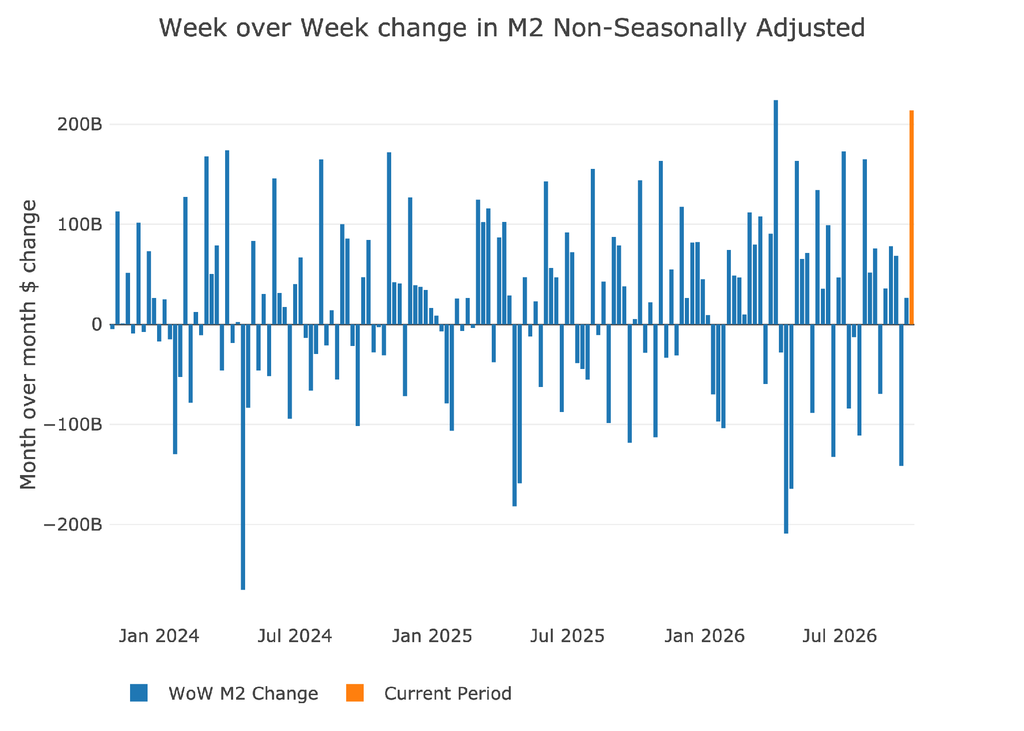
Figure: 5 WoW M2 Change
The “Wenzel” 13-week Money Supply
The late Robert Wenzel of Economic Policy Journal used a modified calculation to track Money Supply. He used a trailing 13-week average growth rate annualized as defined in his book The Fed Flunks. He specifically used the weekly data that was not seasonally adjusted. His analogy was that in order to know what to wear outside, he wants to know the current weather, not temperatures that have been averaged throughout the year.
The objective of the 13-week average is to smooth some of the choppy data without bringing in too much history that could blind someone from seeing what’s in front of them. The 13-week average growth rate can be seen in the table below.
Growth from this perspective has been relatively flat, ranging between 5% and 7% for 41 weeks. The last three weeks have seen a modest increase in the growth rate up to 5.36%.



Figure: 6 WoW Trailing 13-week Average Money Supply Growth
The plot below shows how the latest year compares with previous years. You can see how 2026 is flatter than most of the other years. It did not dip as much around mid-summer but it is also remaining flat where previous years usually see increases around this time.
Even though the trend is flat, it is still above where most past years have been.
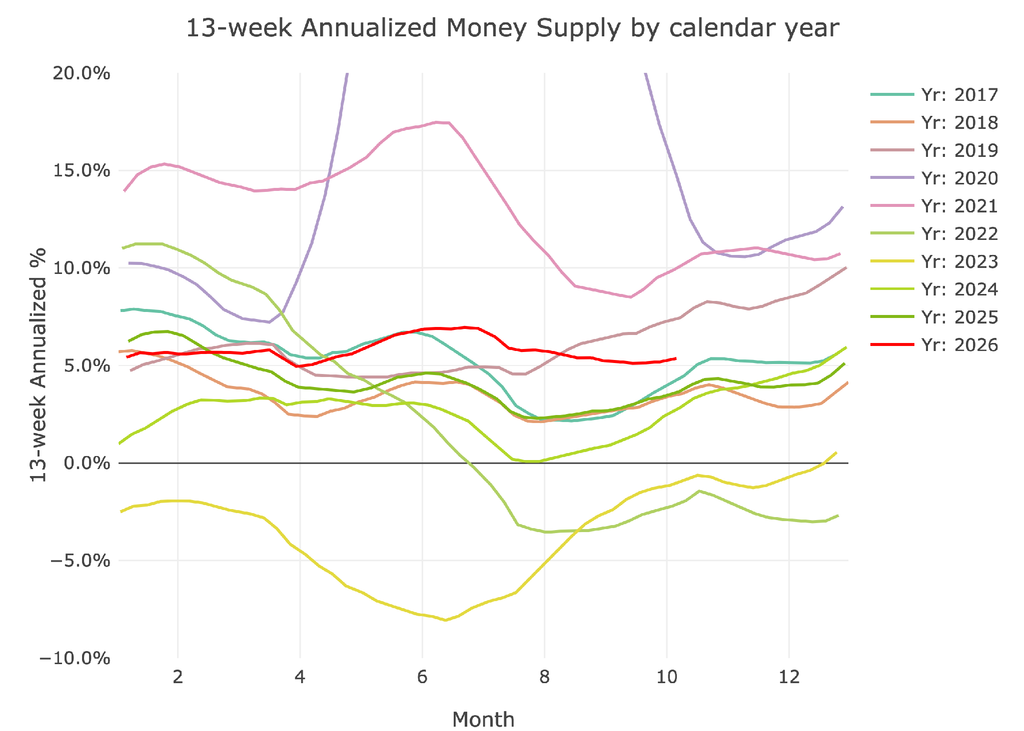
Figure: 7 Yearly 13-week Overlay
Inflation and Money Supply
The chart below shows the history of inflation, Money Supply, and Fed Funds. As shown, in 1970 inflation worked with a ~2 year lag compared to Money Supply. Money Supply slowed dramatically in 2023 and 2024 but has been moving back up. Inflation has also been stickier than the Fed would like, but unfortunately, they cannot do much given the large debt load of the US Government and Corporations. Despite inflation staying elevated, even moving up in the recent period, the Fed has no choice but to keep rates in check.
The inflation rate is at 3.7% which is in line with the Funds rate of 3.75% (even after the recent hike). The inflation rate has remained above 2% for 5 years now, proving much stickier than anyone originally forecast.
To really bring inflation back down, Warsh and the Fed would need to raise rates much higher than the inflation rate. Instead, the Fed is set to hold in October and probably raise in December. Unfortunately, they cannot raise much more for simple mathematical reasons. Thus, it will be hard to bend the inflation curve back down again.
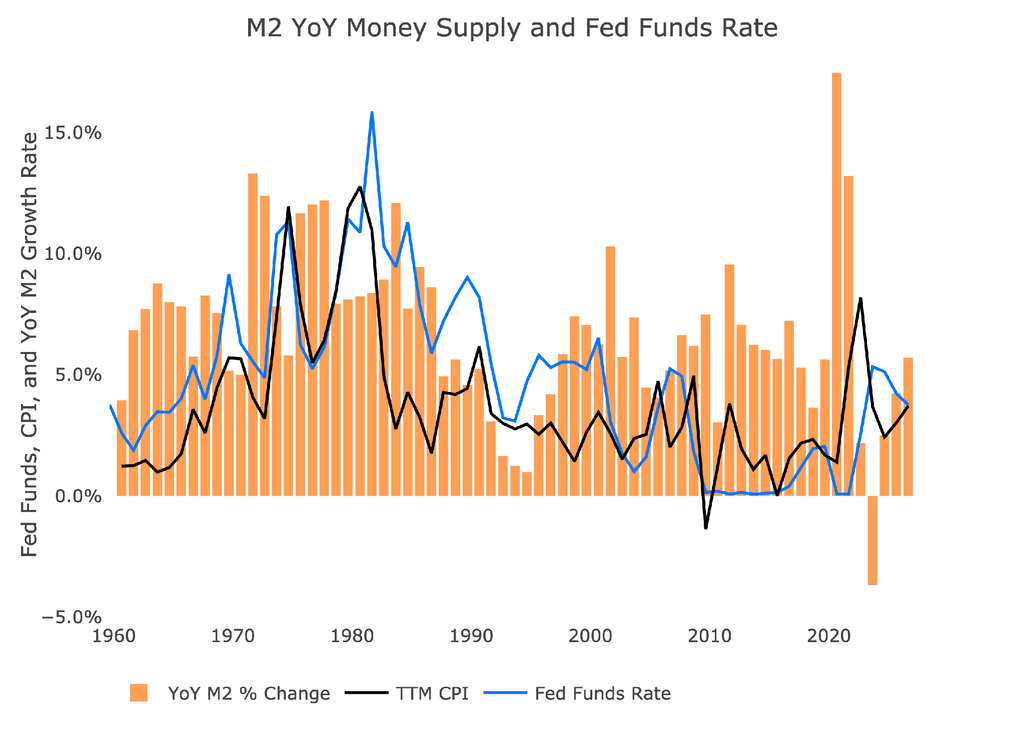
Figure: 10 YoY M2 Change with CPI and Fed Funds
Historical Perspective
The charts below are designed to put the current trends into historical perspective. The orange bars represent annualized percentage change rather than raw dollar amount. You can see that the Money Supply has stayed at a positive and consistent growth level. This is not a good sign if inflation needs to be coming down.
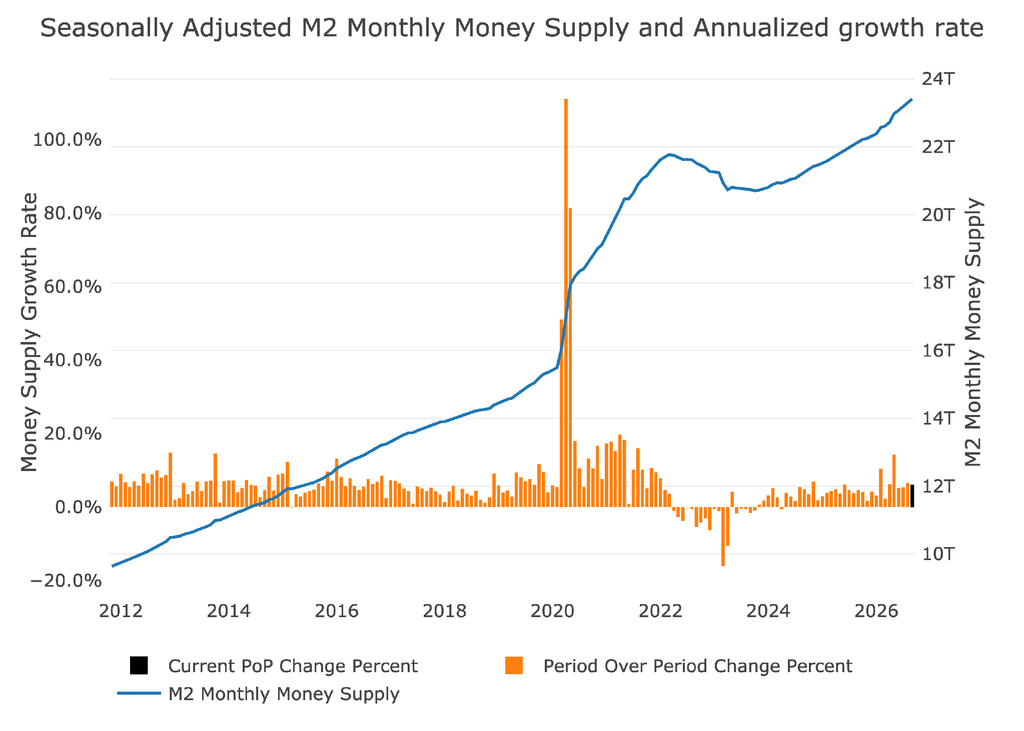
Figure: 9 M2 with Growth Rate
Below shows the 13-week annualized average over history. This chart overlays the log return of the S&P. Mr. Wenzel proposed that large drops in Money Supply could be a sign of stock market pullbacks. His theory, derived from Murray Rothbard, states that when the market experiences a shrinking growth rate of Money Supply (or even negative) it can create liquidity issues in the stock market, leading to a sell off.
While not a perfect predictive tool, many of the dips in Money Supply precede market dips. Specifically, the major dips in 2002 and 2008 from +10% down to 0%. 2022 was highly correlated with a fall in Money Supply and the rebound has corresponded with the big stock market move we saw in 2023 and into 2024.
More liquidity getting pumped into the economy helps explain why the market continues to remain elevated despite all the headline risk. With the Iran war still on, oil prices still elevated, the AI Capex spend, and a ton of uncertainty, one would expect the market to be under more pressure. We have had a pullback in recent weeks, but the market is simply digesting gains after getting a bit ahead of itself. As long as money supply keeps expanding, it is unlikely we see a major break in the market.
Please note the chart only shows market data through October 5th to align with available M2 data.
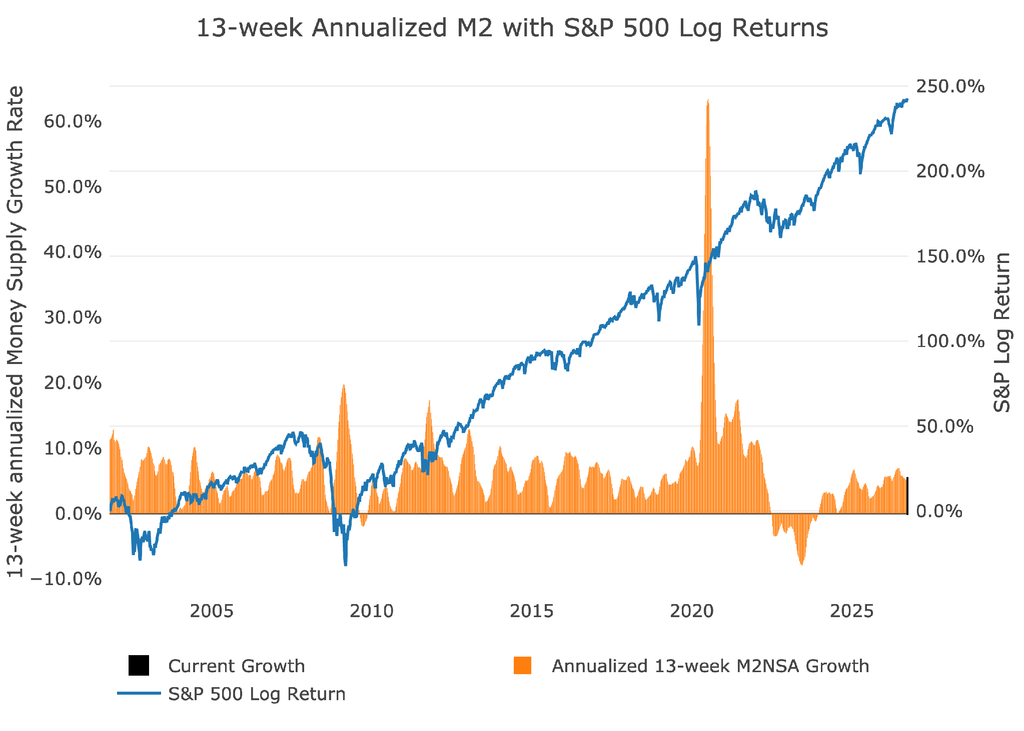
Figure: 10 13-week M2 Annualized and S&P 500
Wrapping Up
To summarize:
- Money Supply continues to rise
- Warsh has done nothing to slow it, in fact it has been more consistently elevated since he took the helm
- 13-week trailing money supply is abnormally flat
- Inflation and the Fed Funds rate are the same which is unlikely to push inflation back down
The Fed has a difficult job on their hands. They need to inflate to remove the burden of the deficit but they have to pretend like they are not going to inflate. Right now, that is exactly what Warsh is doing, but how long can he continue until people do not believe him anymore?

 Live Chat
 Email:
 Phone: 1-888-465-3160