
US Government Has Borrowed $2T in 10 Months
Current Trends
The US government has borrowed over $750B in the last three months. This is a massive sum of money, especially after borrowing $800B in the three months prior. At the current pace, the US Government could borrow close to $3T over a 12-month span. Not only is this completely unsustainable, but the problem is only going to get worse.
Note: Non-Marketable consists almost entirely of debt the government owes to itself (e.g., debt owed to Social Security or public retirement)
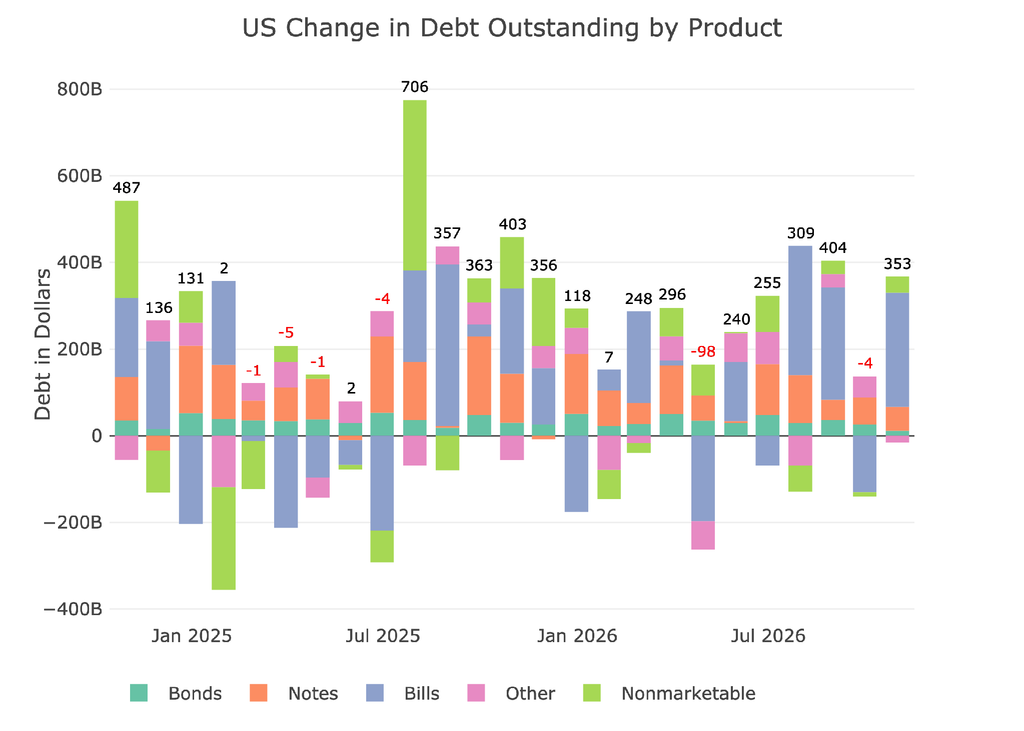
Figure: 1 Month Over Month change in Debt
As shown in the chart below, YTD the government has already borrowed $2T with two months still to go in the year. The Treasury is using a strategy that was deployed back in the days of Janet Yellen. They are issuing far more short-term debt instead of long-term debt. Not only are interest rates lower, but the hope is they can refinance them quickly “when” rates come back down. The problem is what if rates keep going up?
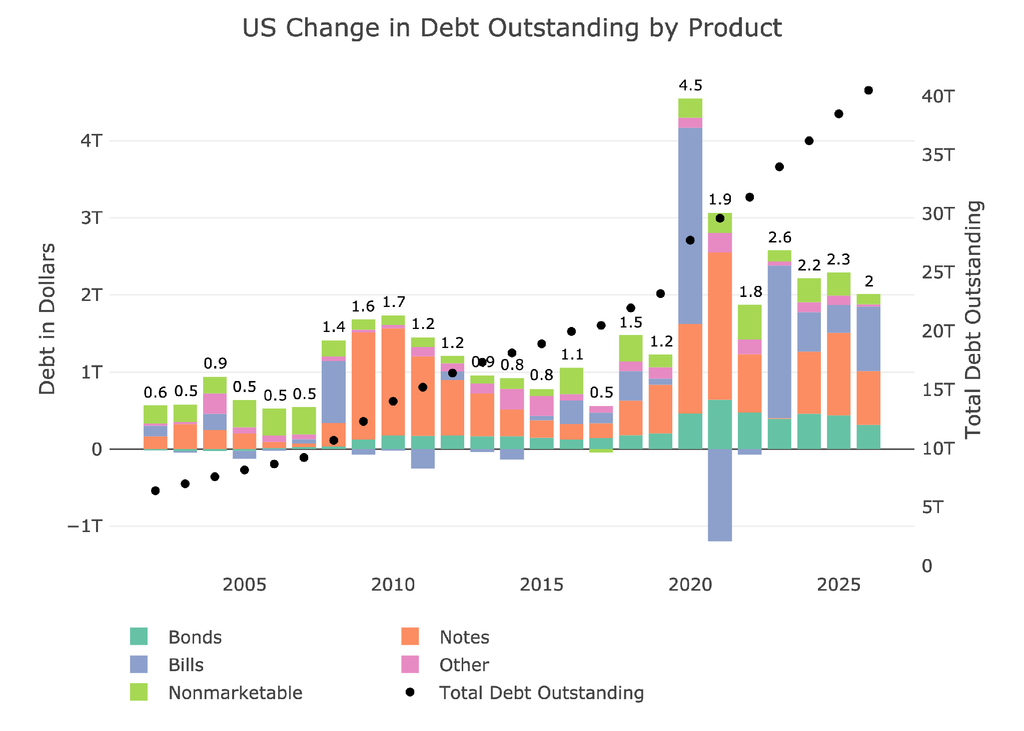
Figure: 2 Year Over Year change in Debt
The Treasury continues to maintain a strong cash position of about $1T. It can lean on this cash hoard in a pinch, such as a debt ceiling being hit. That said, it’s likely the debt ceiling could be retired for good in the next two years given the Democratic Congress with a president who does not want any constraints on spending.
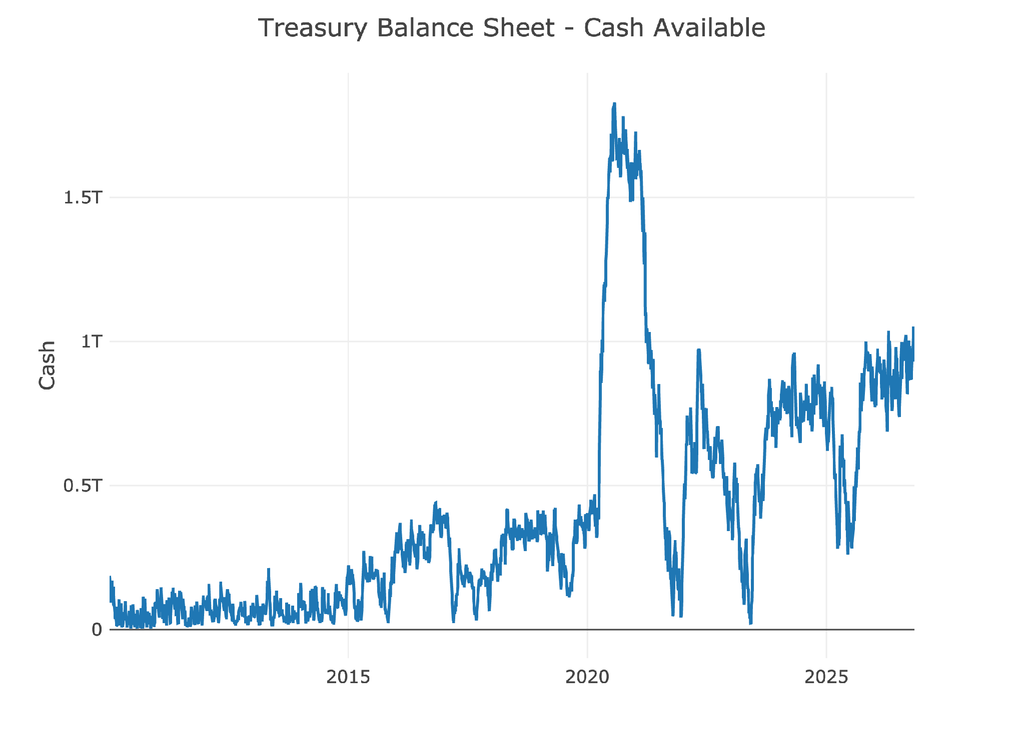
Figure: 3 Treasury Cash Balance
The chart below shows both the maturity of the debt and average interest rate. The blended interest rate has increased to 3.27%. More concerning is the average maturity of the debt is now around 5.7 years. This is dropping rapidly because of the mass issuance of short-term debt.
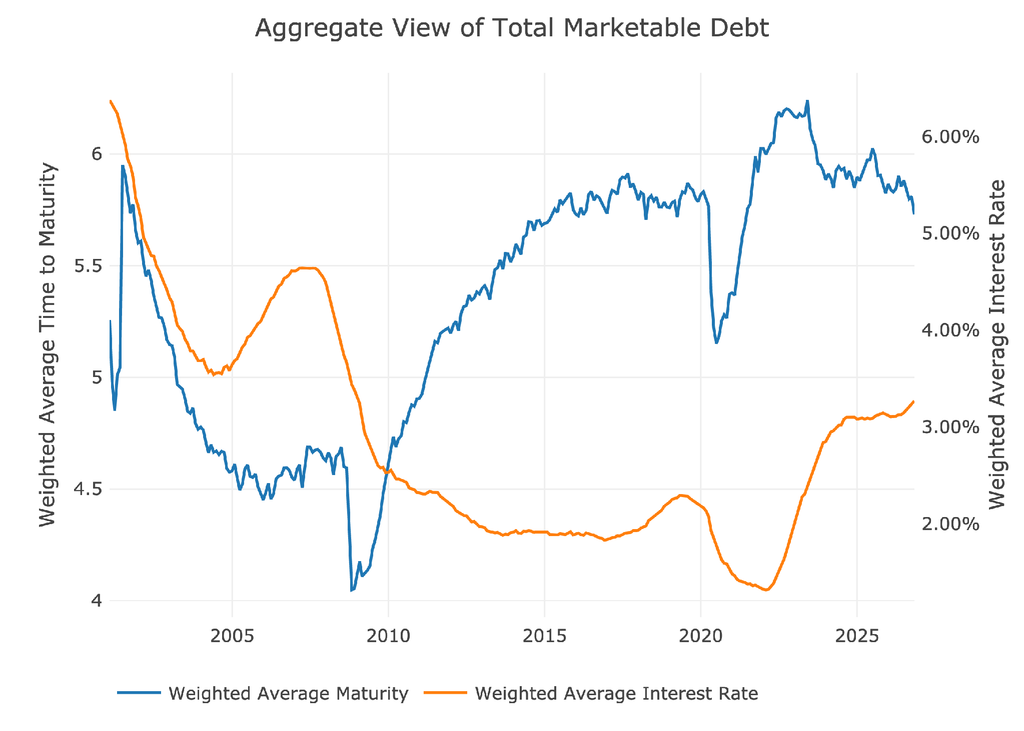
Figure: 4 Weighted Averages
The true danger facing the government is still in the massive interest currently being paid on the debt. Interest now sits above $1T a year! As shown in the chart, about half of this is concentrated in Notes, which is debt maturing between 2 and 10 years. However, Bills are starting to take up more and more of the allocation because of both higher rates and higher issuance.
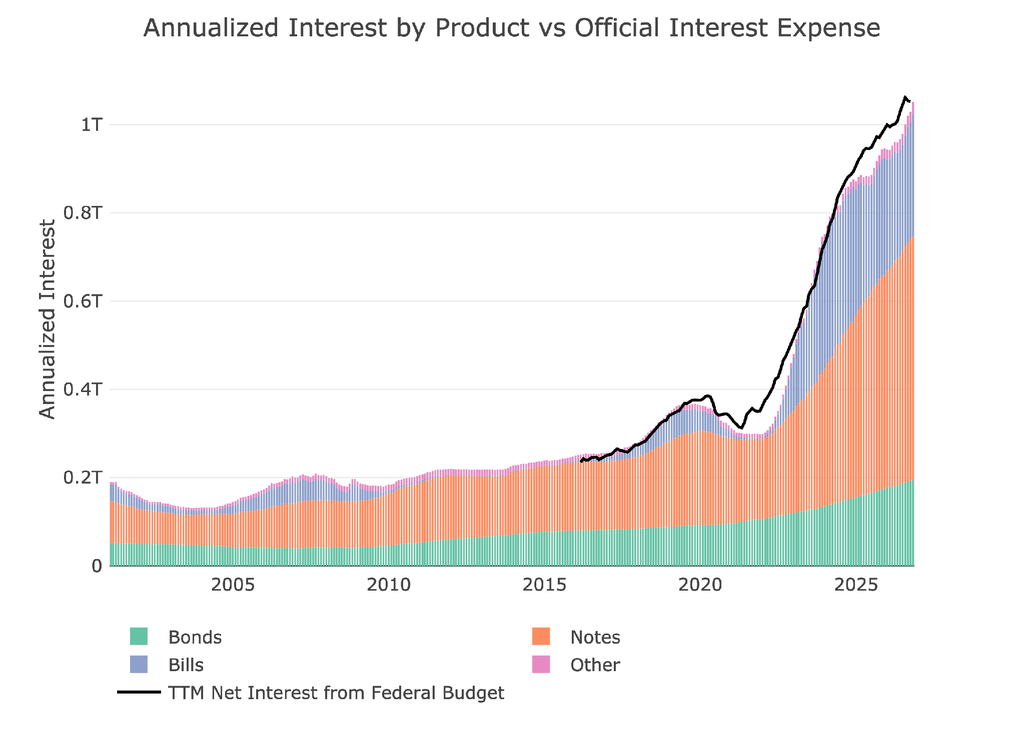
Figure: 5 Net Interest Expense
With the Fed talking about a new tightening cycle, one need only look at the chart below to realize any such effort will be short-lived. Assuming the Fed raised rates just one more time and then does nothing else, interest will exceed $1.2T next year and $1.4T in 2028. That is assuming current rates of around 4% and refinancing existing debt at the same rate. If rates keep climbing, all bets are off.
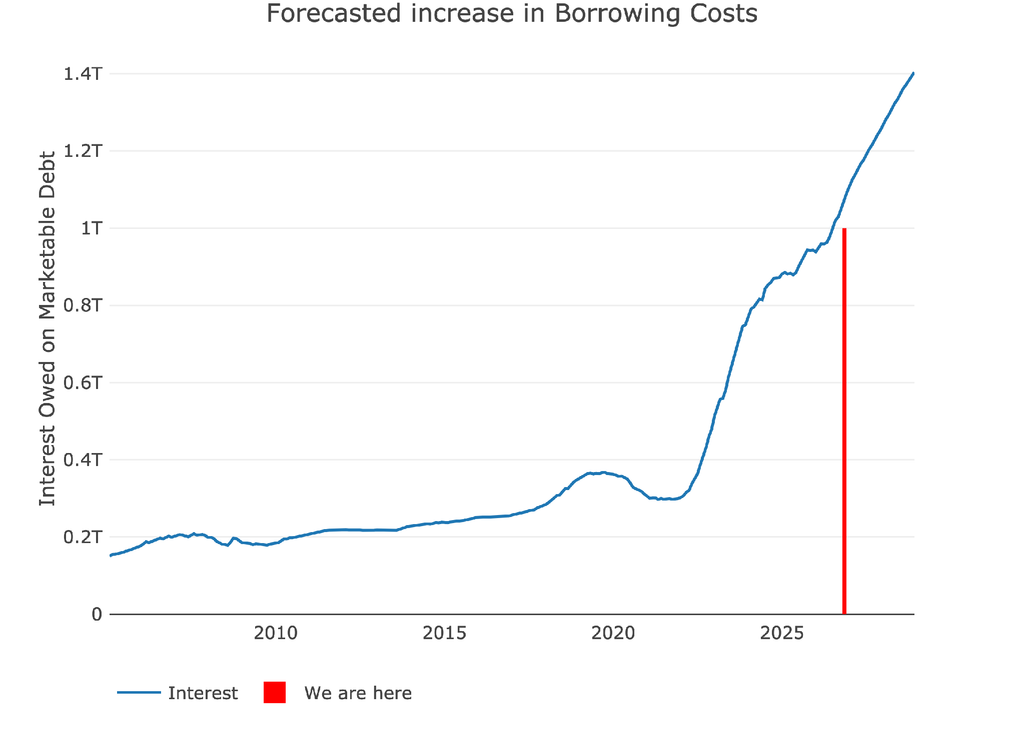
Figure: 6 Projected Net Interest Expense
Speaking of debt issuance and rollover, the chart below shows the forecasted debt maturing for 2-10 year maturities. Debt rolling over will be $800B higher in 2027 than it will be in 2026. Given the large amounts of Bills, there is likely to be a surge in rollover next year as well, worse than what is shown below.
Note “Net Change in Debt” is the difference between Debt Issued and Debt Matured. This means when positive it is part of Debt Issued and when negative it represents Debt Matured
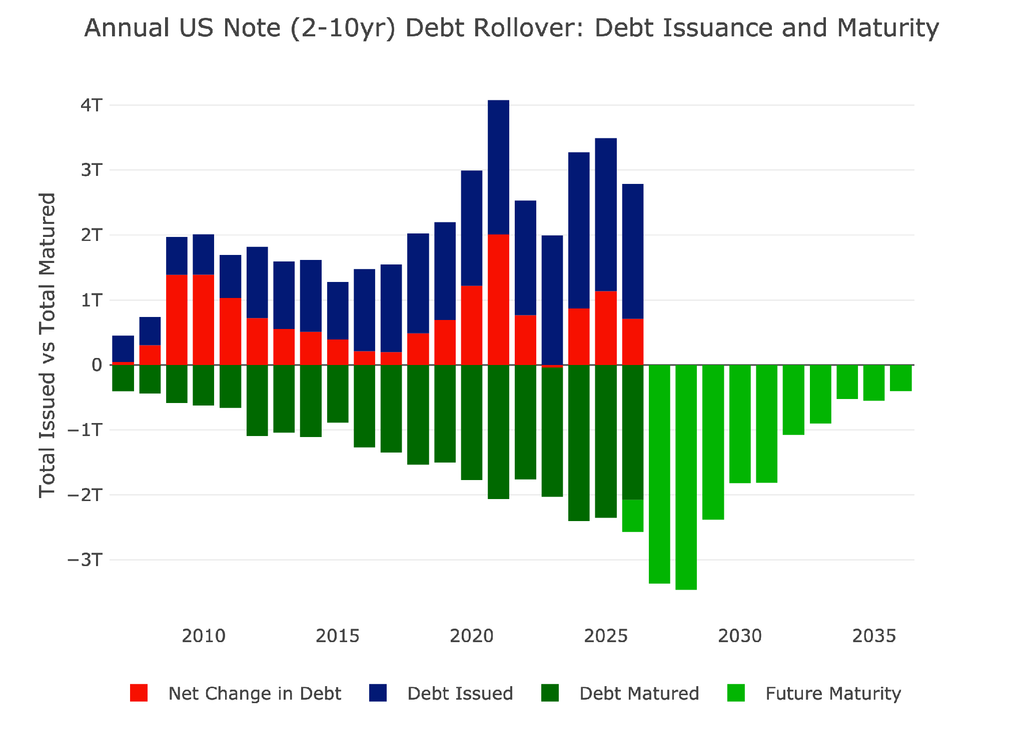
Figure: 7 Treasury Note Rollover
Yield Curve
The yield curve has gone back to a positive slope between the 2 and 10 year. The Treasury was borrowing short-term the entire time it was inverted, which seems like an odd decision. The spread is now narrowing again, but it is still positive.
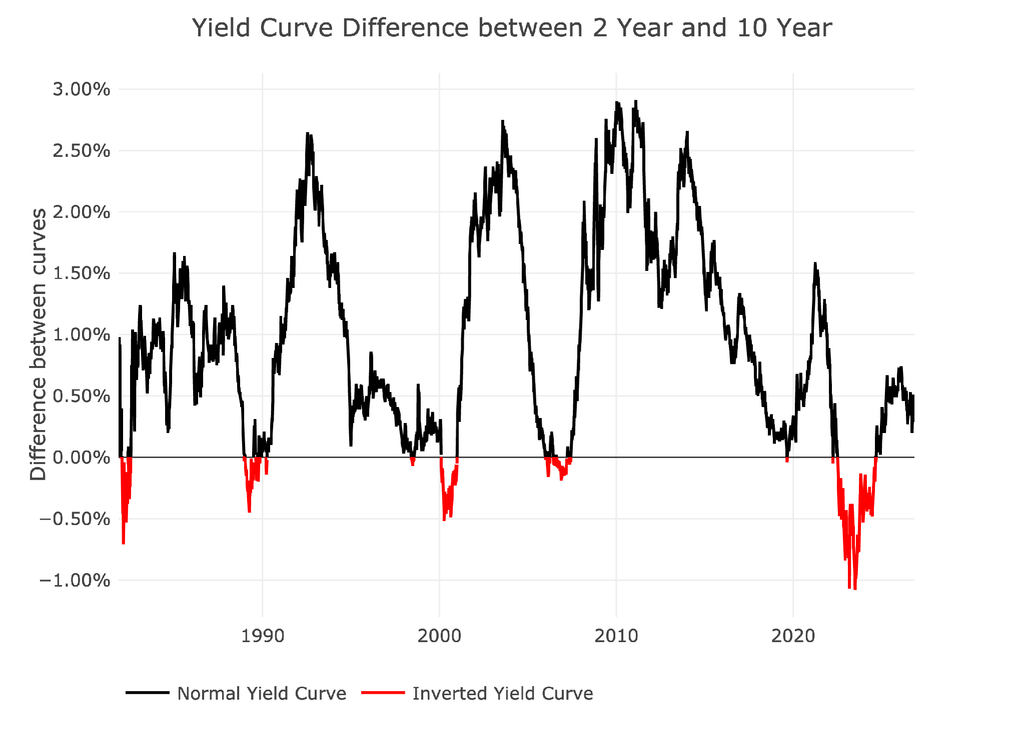
Figure: 8 Tracking Yield Curve Inversion
Historical Perspective
The chart and table below show how the debt and interest has changed over time.
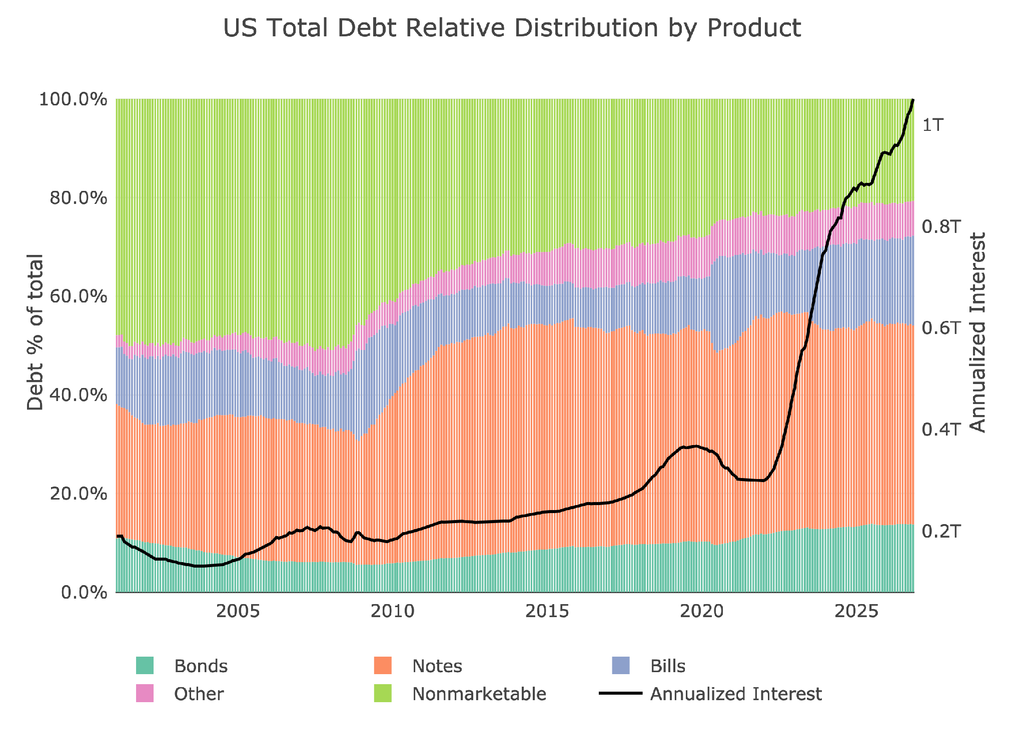
Figure: 9 Total Debt Outstanding
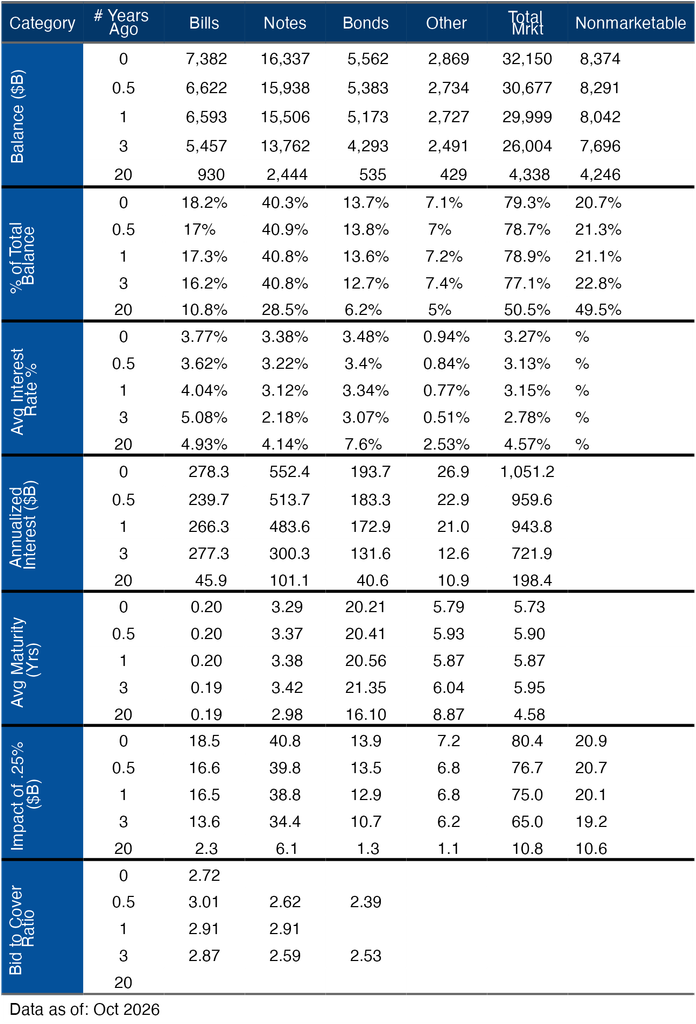
Figure: 10 Debt Details over 20 years
Wrapping Up
The US fiscal situation is completely out of control. The debt has crossed over $40.5T and is growing at over $2T a year. That means, based on the current trajectory, Trump will leave office with at least a $45T debt load. That is likely the rosiest of scenarios. It does not consider a recession or increased spending by the newly elected Democrats. Both seem likely.
Gold and silver are taking a breather for now, but they are going to come back and challenge new all-time highs. The math works in their favor. Gold and silver do get caught up inside technical trading which can cause extensions and wash outs, but the core fundamental story remains unchanged. The US Government is insolvent and the dollar will be destroyed.

 Live Chat
 Email:
 Phone: 1-888-465-3160